Question
Question: Which reaction coordinate diagram best describe the energetics of the following nucleophilic acyl su...
Which reaction coordinate diagram best describe the energetics of the following nucleophilic acyl substitution reaction?
RCOCl(1) + NH3 (2) ⟶ RCONH2 (3) + HCl(4)
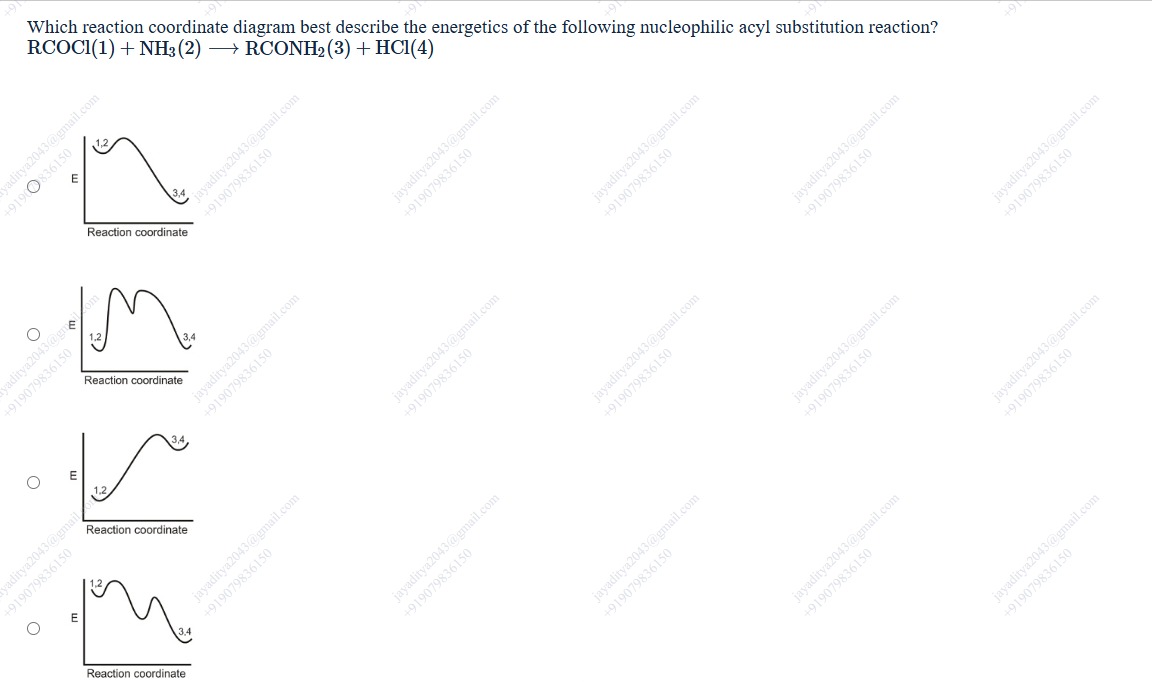
Reaction coordinate diagram. The x-axis is labeled 'Reaction coordinate'. The y-axis is labeled 'E'. The curve starts at a low energy level, rises to a single peak labeled '1,2', and then falls to a lower energy level labeled '3,4'.
Reaction coordinate diagram. The x-axis is labeled 'Reaction coordinate'. The y-axis is labeled 'E'. The curve starts at a low energy level, rises to a first peak labeled '1,2', falls to a local minimum, rises to a second peak, and then falls to a lower energy level labeled '3,4'.
Reaction coordinate diagram. The x-axis is labeled 'Reaction coordinate'. The y-axis is labeled 'E'. The curve starts at a low energy level, rises monotonically to a peak labeled '3,4' after passing a point labeled '1,2'.
Reaction coordinate diagram. The x-axis is labeled 'Reaction coordinate'. The y-axis is labeled 'E'. The curve starts at a low energy level, rises to a peak labeled '1,2', and then falls to a lower energy level labeled '3,4'.
Option 2
Solution
The reaction is a nucleophilic acyl substitution where NH₃ attacks the carbonyl of RCOCl forming a tetrahedral intermediate. This intermediate then collapses to expel Cl⁻ and form the amide. Thus, there are two distinct transition states – one for formation of the intermediate and one for its collapse. Only the diagram with two peaks (first for the addition and second for the elimination) correctly represents this mechanism.