Question
Question: Which one of the following graphs represents correctly the variation of gravitational field intensit...
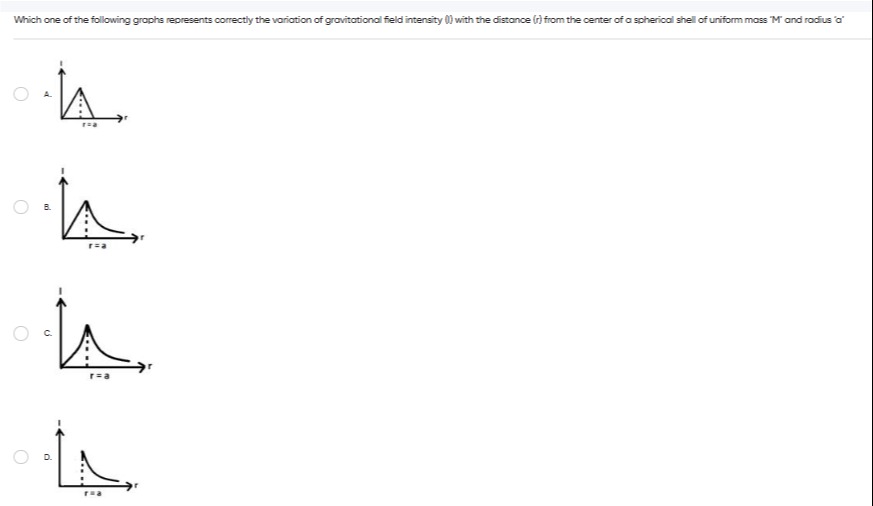
Which one of the following graphs represents correctly the variation of gravitational field intensity (I) with the distance (r) from the center of a spherical shell of uniform mass 'M' and radius 'a'
A
A
B
B
C
C
D
D
Answer
B
Explanation
Solution
The gravitational field intensity inside a uniform spherical shell (r<a) is zero. Outside the shell (r>a), the field intensity is given by I=r2GM, where M is the mass of the shell, G is the gravitational constant, and r is the distance from the center. At the surface of the shell (r=a), the field intensity is I=a2GM. Graph B correctly represents this variation by showing zero intensity for r<a, a peak value at r=a, and a 1/r2 decay for r>a.