Question
Question: Which one of the following graphs represent the velocity of a steel ball which fall from a height on...
Which one of the following graphs represent the velocity of a steel ball which fall from a height on to a marble floor? (Here v represents the velocity of the particle and t the time)
A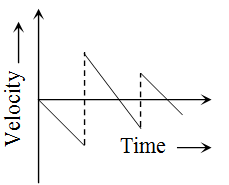
B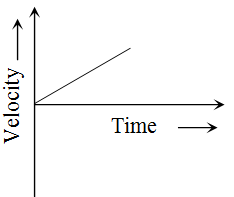
C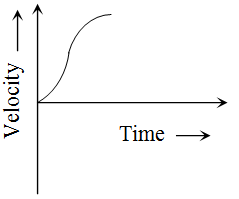
D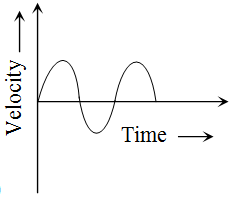
Answer
Explanation
Solution
Initially when ball falls from a height its velocity is zero and goes on increasing when it comes down. Just after rebound from the earth its velocity decreases in magnitude and its direction gets reversed. This process is repeated untill ball comes to at rest. This interpretation is well explained in graph (1).