Question
Question: Which of the following volume (V), temperature (T) plots represents the behaviour of one mole of an ...
Which of the following volume (V), temperature (T) plots represents the behaviour of one mole of an ideal gas at one room atmosphere?
(A) 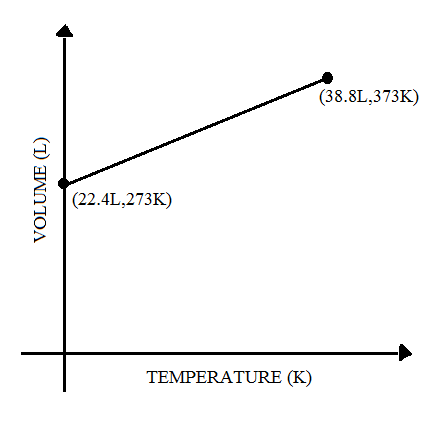
(B) 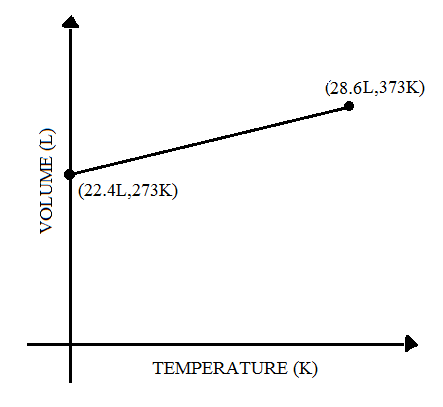
(C) 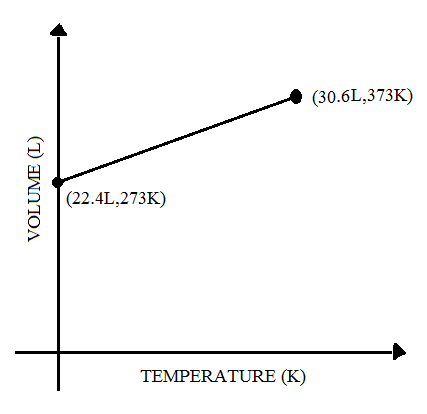
(D) 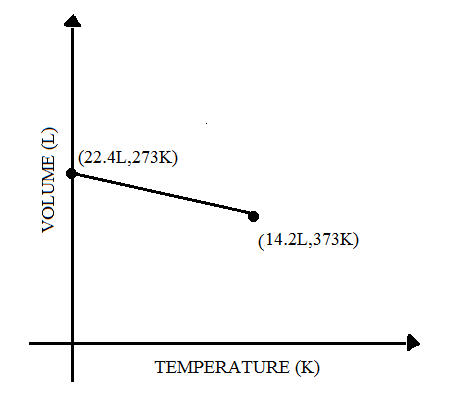
Solution
To solve this we should know to read the graph carefully at first as it gives many clues and secondly, we should know the ideal gas equation. These factors above are very important to solve this question.
Complete step by step answer:
If we carefully observe the graph we can see that in every graph there are two points marked. let (i) represent points on the y-axis and let other points be (ii).
A gas is said to be ideal gas when the gas obeys Boyle's law, Charle's law and Avagado's law that is the gas does not show any deviation from above mentioned law.
Firstly let's see what ideal gas equation is:
PV= nRT
Where, P = pressure
V = volume
n = number of moles
R = gas constant
T = temperature
If a graph is plotted between volume and temperature then the pressure is at constant (from Charles's law).
For point (i): let the volume and temperature be V1 and T1 respectively. we know that P is constant and the number of moles is equal to 1.
PV1=nRT1 equation 1
Where, V1= 22.4L
T1= 273K
For point (ii): let the volume and temperature be V2 and T2 respectively. We know that P is constant and the number of moles is equal to 1.
implies PV2=nRT2 equation 2
Where, V2= ?
T2= 373
We have to find the value ofV2, because if we observe only the value of V2 is changing. So to find which one is the correct graph divide equation 1 and 2.
PV2PV1=nRT2nRT1
As we know pressure and number of moles, gas constants are the same for both the equation 1 and 2. Therefore, they cancel out each other.
So, V2V1=T2T1 equation 3
Substituting value of V1,T1and T2 in equation 3 and find V2:
⟹V2=273373×22.4
⟹V2=30.6
In the graph of Option C the V2 value is 30.6.
Thus option C is the correct answer.
Note: Always try to read the graph carefully, because that gave the biggest clue that here only the value of is V2 changing. Secondly, be thorough with Boyle's law, Charles's law and Avogadro's law as this gives the clue that which quantities among the three variable quantities (P,T,V) is constant whenever a graph is plotted between any two.