Question
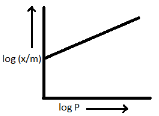
Question: Which of the following plot is in accordance with Freundlich adsorption isotherm? A.
B.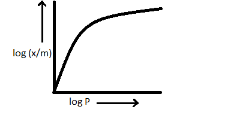
C.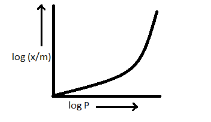
D.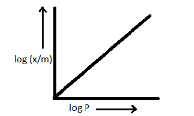
Solution
As we know that an adsorption isotherm is a graph which represents the variation in the amount of adsorbate adsorbed on the surface of the adsorbent with the change in pressure (at a constant temperature). We will use the relation extracted from Freundlich adsorption isotherm and convert it into an equation of logarithms to easily draw its graph.
Formula used: We will use the following relation:-
mx=KP1/n
Complete step-by-step answer: “The empirical relationship between the quantity of a gas i.e., adsorbate adsorbed into a solid surface and the gas pressure at constant temperature is known as The Freundlich equation or Freundlich adsorption isotherm”. This relationship is also applicable for the concentration of a solute adsorbed on the surface of a solid and the concentration of the solute in the liquid phase.
Mathematically this relation can be expressed as:-
mx=KP1/n
where,
x = mass of adsorbate
m = mass of adsorbent
P = equilibrium pressure of the gaseous adsorbate.
c = equilibrium concentration of adsorbate.
-Conversion of relation into logarithmic equation:-
mx=KP1/n
On taking log both sides:
⇒logmx=logKP1/n
⇒logmx=logK+logP1/n (as logAB=logA+logB) ⇒logmx=logK+n1logP (as logan=nloga)
This equation is just like the equation of straight line i.e., y = mx+c where m is the slope and c is the intercept.
On comparing the Freundlich adsorption isotherm equation to straight line equation, we get:-
y=logmx x=logP m=n1 c=logK
On plotting the straight line equation from the above values, we get:-
Hence, the correct option is (A).
Note: -Experimentally it was seen that extent of gas adsorption varies directly with pressure and thereafter it directly varies with pressure raised to the power n1 until saturation pressure is reached. Beyond that point, the rate of adsorption would not change even after applying higher pressure and therefore we can say that the Freundlich adsorption isotherm fails at high pressure.