Question
Question: Which of the following lines correctly shows the temperature dependence of equilibrium constant, K, ...
Which of the following lines correctly shows the temperature dependence of equilibrium constant, K, for an exothermic reaction?
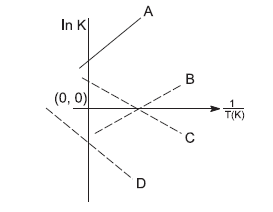
(A) C and D
(B) A and D
(C) A and B
(D) B and C
Solution
To solve this question, we first need to derive an equation that gives the relation between the equilibrium constant of a reaction and the temperature of the reaction.
Since the change in Gibbs free energy can be related to both equilibrium constant and temperature, it can be used to derive the equation relating r=equilibrium constant and temperature.
Complete answer:
The relation between Gibbs free energy and the equilibrium constant K is given by the following equation
ΔG∘=−RTlnK
Where ΔG∘ gives the change in Gibbs free energy, the equilibrium constant is given by K, the reaction of the temperature is given by T and R is the gas constant having value 8.314J/mol.K
Also, we know that when there is no change in the temperature of the reaction, the change in Gibbs free energy is given by
ΔG∘=ΔH∘−TΔS∘
Where the change in enthalpy of the system is given by ΔH∘ and change in the entropy of the system is given by ΔS∘.
So, we can say that