Question
Question: Which of the following is the graph of a cubic function? A)  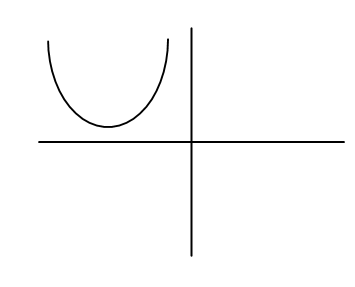
B) 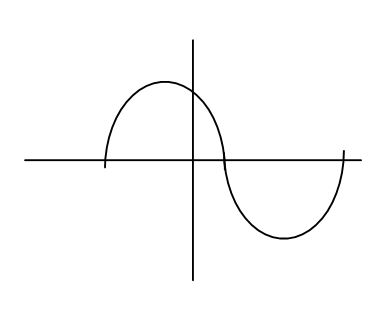
C) 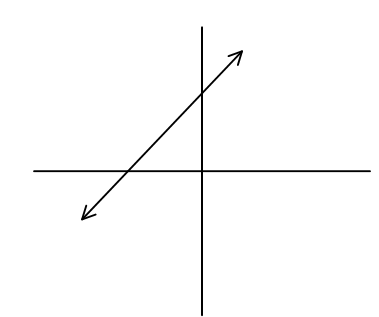
D) 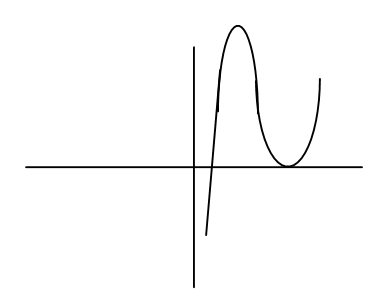
Solution
Here we have to find the graph of the cubic function. The cubic function is a polynomial of degree three. Now simply we will find the graph of a simple cubic function y=x3 and then compare the obtained graph with the graph given in the option.
Complete step by step solution:
Here we have to find the graph of the cubic function
Let us take a one cubic function.
⇒y=x3
Now, we will plot the graph of the following cubic function.
Plot the graph
Put when x=1 then y=1
When x=2 then y=8
When x=3 then y=27
By doing this procedure we will make a table,
| X | 1 | 2 | 3 | 4 | 5 |
|---|---|---|---|---|---|
| y | 1 | 8 | 27 | 16 | 125 |
Similarly repeat this process for the negative numbers
i.e. when x=−1 then y=−1 ;
when x=−2 then y=−8 ;
when x=−3 then y=−27
by continuing we get
| x | -1 | -2 | -3 | -4 | -5 |
|---|---|---|---|---|---|
| y | -1 | -0 | -27 | -64 | -125 |
Now, using the table 1 and table 2 we will plot the graph of cubic function
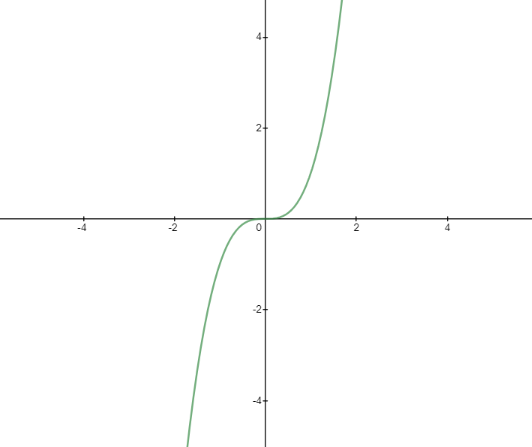
The above obtained graph is similar to the graph in option (B) and option (D) also the graph can be complicated if the variables in the cubic function increases i.e. y=ax3+bx2+c .
In option (C) the graph is a straight line that means option (C) represents the linear equation and option (A) represents the parabola. Option (D) is the correct answer.
Note:
In the above discussion we have plotted the graph of the cubic function. The graph obtained is not for all the cubic functions but the characteristic of the graph is the same for all cubic functions and also the graph of the cubic function would be symmetric in the opposite quadrant.