Question
Question: Which of the following graphs show the relationship between atomic number (x-axis) and atomic radius...
Which of the following graphs show the relationship between atomic number (x-axis) and atomic radius (y-axis) for the elements in period 2?
A.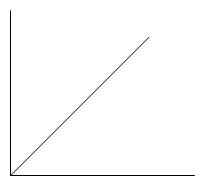
B.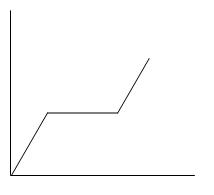
C.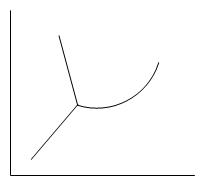
D.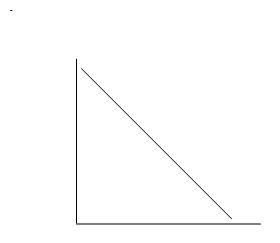
E.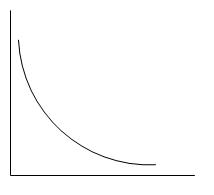
Solution
To answer this question, you must recall the trend of periodic properties. As we move along a period the atomic number of the elements keep on increasing. When we move down the group, the number of shells in the atoms increases.
Complete step by step solution:
We know that the Modern Periodic Law states that the physical and chemical properties of elements are the periodic functions of their atomic numbers.
Atomic radius is the half of the distance between the centers of two atoms touching each other or we can say that it is the distance between the nucleus of an atom and its valence shell.
When we move down the group, the atomic radius increases as down the group a new shell is added which is farther away from the nucleus than the previous one. Whereas, when we move from left to right in a period, atomic radius decreases. This is because there is an increase in the number of protons which results in an increasing nuclear charge and the valence shell is attracted closer to the nucleus.
Thus, we can say that atomic number and atomic radii are inversely proportional to each other while moving across a period.
Thus, the correct answer is D.
Note:
The periodic table can be used to derive relationships between various physical and chemical properties and behaviour of elements. The modern periodic table provides an essential framework that helps in the analysis of various chemical reactions, and is used widely in the fields of chemistry, nuclear physics and other sciences.