Question
Question: Which of the following graphs represent the correct graph between Pv and P of one mole of gas at con...
Which of the following graphs represent the correct graph between Pv and P of one mole of gas at constant temperature?
A) 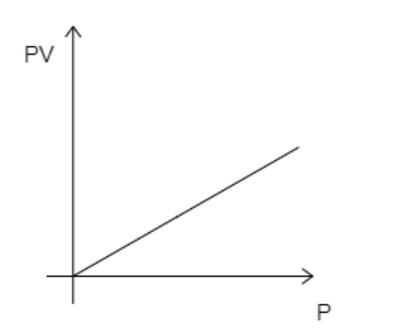
B) 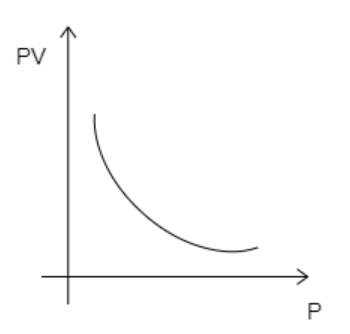
C) 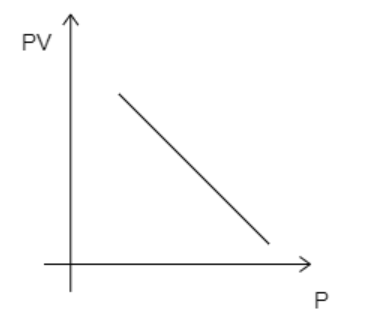
D) 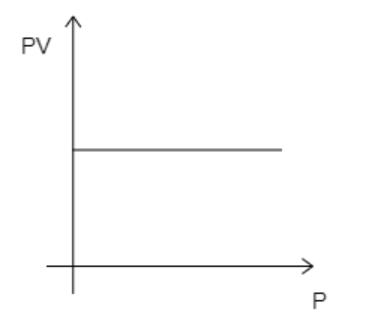
Solution
The ideal gas equation describes an empirical relation between the pressure of a gas, its volume, the temperature of the gas and the number of moles present in the given sample of gas. According to the ideal gas equation, PV remains constant if the temperature remains fixed.
Formula used:
-The ideal gas equation is given by, PV=nRT where P is the pressure of the gas, V is the volume of the gas, n is the number of moles present in the gas sample, R is the gas constant and T is the temperature.
Complete step by step answer.
Step 1: Describe the features of the required graph.
The required graph is drawn with pressure P along its X-axis and PV along its Y-axis. The graph is obtained at a constant temperature for one mole of gas.
The ideal gas equation is given by, PV=nRT --------- (1)
where P is the pressure of the gas, V is the volume of the gas, n is the number of moles present in the gas sample, R is the gas constant and T is the temperature.
Here, the number of moles, n=1 . Now, if the temperature is kept constant, then all the variables on the left-hand side of equation (1) will be constant. This then implies that PV remains constant. So, even if pressure is increased, PV will remain constant. This suggests that the graph must be a straight line parallel to the X-axis. The correct graph will take the form given below.
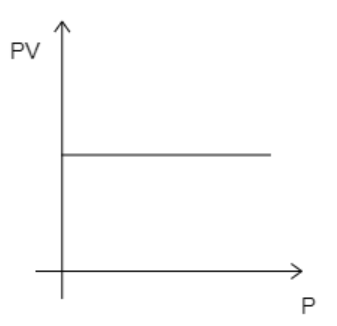
While analyzing the given graphs we see that graph 4 matches our description.
Hence, the correct option is D.
Additional information: The relationship depicted by PV=constant for constant temperature is referred to as Boyle’s law.
Note: When the temperature is kept constant and if pressure is increased we saw that PV does not change. This is because as the pressure increases the volume of the gas decreases and thereby nullifies any change in PV.