Question
Question: Which of the following graphs may represent the relation between the capillary rise and the radius \...
Which of the following graphs may represent the relation between the capillary rise and the radius rof the capillary?
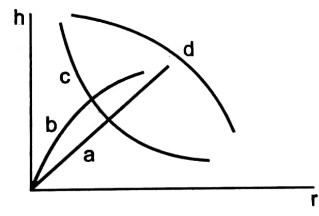
A. a
B. b
C. c
D. d
Solution
Capillary action is the process of a liquid flowing in small areas without the aid of external forces like gravity, or even in opposition to them. Liquids can be drawn up between the hairs of a paintbrush, in a narrow tube, in porous materials like paper and plaster, in non-porous materials like sand and liquefied carbon fibre, or in a biological cell.
Complete step by step answer:
Intermolecular forces between the liquid and the surrounding solid surfaces create this. If the tube's diameter is small enough, the liquid is propelled by a combination of surface tension and adhesion forces between the liquid and the container wall. Because both processes are opposed by viscous forces, capillary penetration in porous media has a similar dynamic mechanism to flow in hollow tubes.
As a result, the capillary tube is a frequent tool for demonstrating the phenomena. A concave meniscus formed when the lower end of a glass tube is immersed in a liquid, such as water. The liquid column is pulled along by adhesion between the fluid and the solid inner wall until there is enough liquid mass for gravity forces to overcome the intermolecular forces.
The radius of the tube is related to the contact length (around the edge) between the top of the liquid column and the tube, whereas the weight of the liquid column is proportional to the square of the tube's radius. So, if the inner water molecules cohere sufficiently to the outer ones, a narrow tube will draw a liquid column along further than a larger tube.
h=rρg2Scosθ is the height h through which a liquid will ascend in a capillary tube of radiusr.where S denotes surface tension, ρ denotes liquid density, and θ denotes contact angle.
Because h ∝r1 is true, the graph between h and r will be a rectangular hyperbola.
So, option C is correct.
Note: Capillary activity can be detected in a variety of plants. Water is carried high up in trees by branching; evaporation at the leaves causes depressurization; osmotic pressure is likely provided at the roots; and potentially other areas inside the plant, especially when collecting humidity with air roots.