Question
Question: Which of the following graphs best represents the graphical relation between momentum ( \( P \) ) an...
Which of the following graphs best represents the graphical relation between momentum ( P ) and kinetic energy ( K ) for a body in motion?
(A) 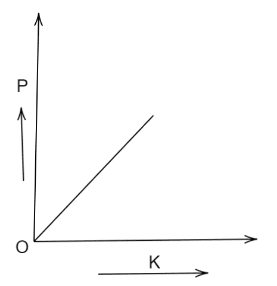
(B)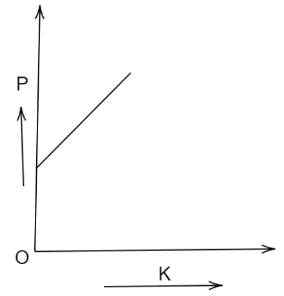
(C)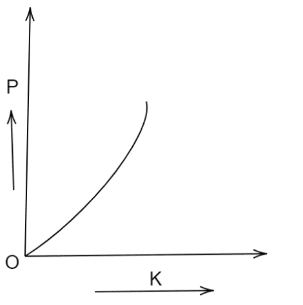
(D)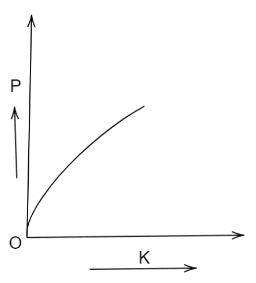
Solution
To get the required answer, we need to find what is kinetic energy and what is momentum for a body in motion, get a relation between them and accordingly see which graph is perfect for describing the relation between kinetic energy and momentum.
Complete answer:
The product of a particle's mass and velocity is its momentum. The temporal rate of change of momentum is proportional to the force applied on the particle, according to Isaac Newton's second law of motion.
P=mv where, m is the mass of the body, v is the velocity of the body.
The type of energy that an item or particle has as a result of its movement is known as kinetic energy. When an object is subjected to a net force, it accelerates and gains kinetic energy as a result. Kinetic energy is a property of a moving object or particle defined by both its mass and its velocity.
K=21mv2
Therefore, K=2mP2
As a result, the graph between P and K will be a parabola, and if k is on the x axis, the parabola will be concave towards the positive x-axis side.
Hence, option D) is the correct option.
Note:
The total of the momenta of each particle in a rigid body is the body's momentum. Translation (movement along a path from one location to another) is conceivable due to kinetic energy, as can rotation around an axis, vibration, or any combination of motions.