Question
Question: Which of the following graph truly represents the titration of KCl solution against $AgNO_3$ solutio...
Which of the following graph truly represents the titration of KCl solution against AgNO3 solution?
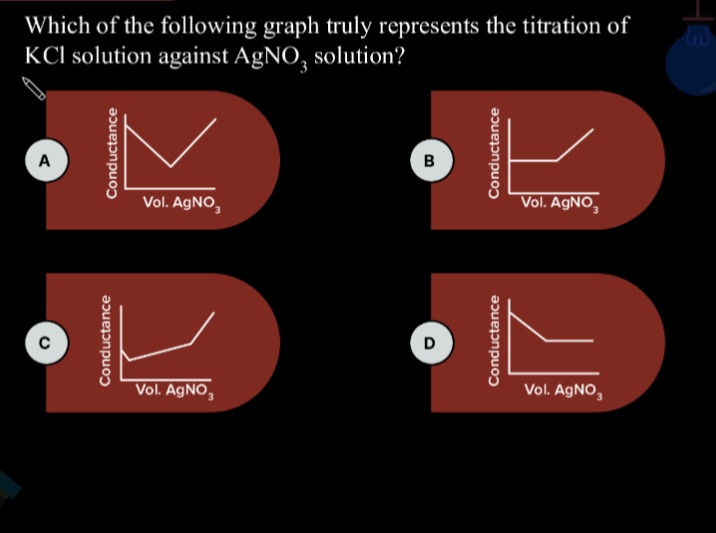
Graph A shows a decrease followed by an increase, forming a V-shape with the increasing segment having a steeper slope than the decreasing segment. This matches our analysis.
Graph B shows a constant conductance followed by an increase. This is incorrect.
Graph C shows a decrease followed by an increase, but the initial decrease is not linear, and the increase is also not linear in the initial part. The shape is generally correct, but the linearity of the segments is expected in ideal conductometric titrations.
Graph D shows a decrease followed by a constant conductance. This is incorrect.
Graph A
Solution
The titration of KCl solution against AgNO3 solution is a conductometric titration. The reaction is:
KCl(aq)+AgNO3(aq)→AgCl(s)+KNO3(aq)
Initially, the solution contains K+ and Cl− ions. The conductance of the solution is due to these ions. As AgNO3 is added, Ag+ ions react with Cl− ions to form insoluble AgCl precipitate. The ions in the solution are K+, Cl−, and NO3− (from added AgNO3). Effectively, Cl− ions are removed from the solution and replaced by NO3− ions. The molar conductivity of Cl− ions (λCl−≈76.3 S cm2 mol−1) is slightly higher than that of NO3− ions (λNO3−≈71.4 S cm2 mol−1). Therefore, as Cl− ions are replaced by NO3− ions, the conductance of the solution decreases. This decrease continues until all Cl− ions have been precipitated, which is the equivalence point.
At the equivalence point, all Cl− ions have reacted with Ag+ ions. The solution contains K+ and NO3− ions. The conductance is at a minimum at the equivalence point because the highly mobile Cl− ions have been removed and replaced by less mobile NO3− ions, and no excess ions from the titrant have been added yet.
After the equivalence point, excess AgNO3 is added to the solution. The solution now contains K+, NO3−, and excess Ag+ and NO3− ions. The addition of Ag+ and NO3− ions increases the total number of ions in the solution, and these ions are mobile. The molar conductivity of Ag+ ions is approximately 61.9 S cm2 mol−1, and that of NO3− ions is approximately 71.4 S cm2 mol−1. The addition of these ions leads to an increase in the conductance of the solution.
Therefore, the graph of conductance versus the volume of AgNO3 added should show an initial decrease in conductance before the equivalence point, reaching a minimum at the equivalence point, and then an increase in conductance after the equivalence point. This results in a V-shaped graph.
Comparing the slopes of the two segments:
Before the equivalence point, the decrease in conductance is due to the replacement of Cl− by NO3−. The change in molar conductivity is approximately λNO3−−λCl−≈71.4−76.3=−4.9.
After the equivalence point, the increase in conductance is due to the addition of Ag+ and NO3−. The increase in molar conductivity per mole of AgNO3 added is approximately λAg++λNO3−≈61.9+71.4=133.3.
Considering the concentration of the titrant and the volume change, the slopes are proportional to these values. If the titrant concentration is the same, and neglecting volume change for qualitative comparison of slopes, the magnitude of the slope after the equivalence point is significantly larger than the magnitude of the slope before the equivalence point.
Based on the expected linear segments in conductometric titrations and the relative slopes, graph A is the most accurate representation of the titration. The initial decrease is due to the replacement of Cl− by NO3−, and the subsequent increase is due to the addition of excess Ag+ and NO3−. The steeper slope after the equivalence point is consistent with the higher combined molar conductivity of Ag+ and NO3− compared to the difference in molar conductivity between Cl− and NO3−.