Question
Question: Which of the following figures represent the variation of particle Momentum and the associated De Br...
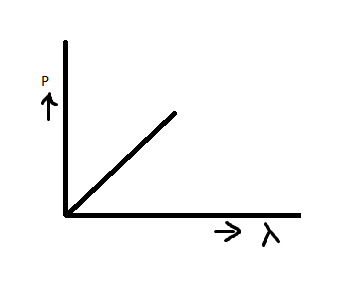
Which of the following figures represent the variation of particle Momentum and the associated De Broglie Wavelength?
(A)
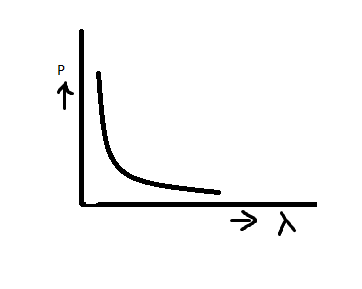
(B)
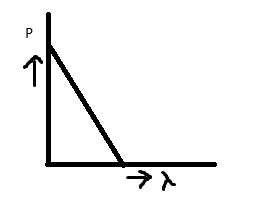
(C)
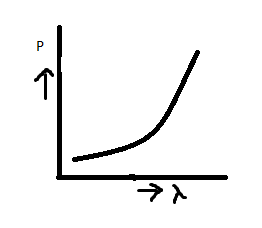
(D)
Solution
usually the relation between the De-Broglie wavelength and the linear momentum is calculated from the photon energy.
The De Broglie equation gives the De Broglie wavelength to the ratio of the plant constant and linear momentum.
The wavelength is inversely proportional to the Square root of the potential.
Formula Used:
Here the formula is used to find the solution. The momentum of the photon is given P=λh
Here,
E is the Photon energy
c is the speed of the light
h is the plank constant
λ is the De Broglie wavelength.
Complete step-by-step solution:
The wavelength which is associated with an object about its momentum and mass known as the de Broglie wavelength
wavelength is inversely proportional to force.
The photon momentum is given by,
P=cE=λh
Here,
E is the Photon energy
c is the speed of the light
h is the plank constant
λ is the De Broglie wavelength.
According to the de Broglie , P=λh
By using this relation we can say that the linear momentum of a photon is inversely proportional to the de Broglie wavelength .The graph looks like a rectangular hyperbola.

Here the correct answer is (B) .
Note: We know that matter has a dual nature of wave particles. The property of the material object varies in time or space while it behaves similarly to waves.
It holds similarity to the dual nature of light and it behaves as particle and wave
The objects we can see in our day-to-day life have wavelengths that are very small and invisible.