Question
Question: Which of the following curves represents Henry's law? (A)- - 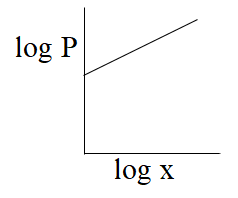
(B)- 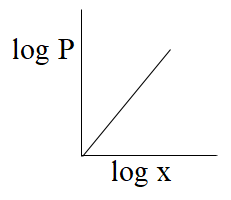
(C)- 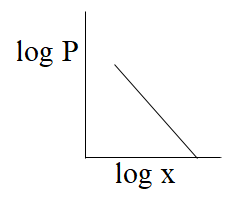
(D)- 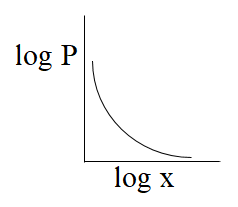
Solution
To get know about the curve or graph from the above given options which is representing Henry's Law, first we have to change the Henry’s Law equation into the logarithm form.
Complete step by step answer:
- Henry’s Law states that, the amount of any gas which is dissolved in any solvent is directly proportional to the partial pressure of that gas with the solvent in the equilibrium condition.
Mathematically Henry’s Law shown as follow:
m = KP……….. (i)
Where, x = amount of dissolved gas
P = partial pressure of gas in atm
K = Henry’s constant.
Now taking log on both sides of equation (i), we get
log (x) = log (KP)
log x = log K + log P
Or log P = log K - log x………….. (ii)
Now, compare the equation (ii) with the straight line equation i.e. y = mx
So, we get y = logP
mx = - log x
Slope m = - 1
Intercept C = log K.
From the above comparison of henry’s equation with the straight line equation it is clear that straight line of the graph or curve doesn’t goes through the origin as it has some value of intercept which is equal to logK, & slope of the graph is negative as value of m is -1.
So, from the above all graphs only the graph which is given option (C) represents henry's law.

The correct answer is option “C” .
Note: In this question some of you may consider this equation log x = log K + log P only to find the graph which is representing henry’s law but that will be wrong because the quantity present on the left side represents the y-axis and in all options in y-axis, log x is not given. That’s why we rearrange the log x = log K + log P equation to equation (ii).