Question
Question: Which of the curves in the figure represents the relation between Celcius and Fahrenheit temperature...
Which of the curves in the figure represents the relation between Celcius and Fahrenheit temperature?
(A) 1
(B) 2
(C) 3
(D) 4
Solution
Temperature scales are used to measure temperature. There are three scales for measuring temperature. Temperatures can be transferred from one scale to another scale by applying the temperature conversion equations. Use the relation between the Celcius scale and Fahrenheit scale to know the nature of the graph.
Formula Used:
The conversion equation for Celsius to Fahrenheit scale is:
C=95(F−32)
C is the value with the Celcius unit and F is the value of temperature with the Fahrenheit scale.
Complete step-by-step solution:
Temperatures can be transferred from one scale to another scale by applying the temperature conversion equations. Hence we can convert temperature from the Celcius scale to the Fahrenheit scale.
The conversion equation for Celsius to Fahrenheit scale is:
C=95(F−32)
⇒C=95F−9160
C is the value with the Celcius unit and F is the value of temperature with the Fahrenheit scale.
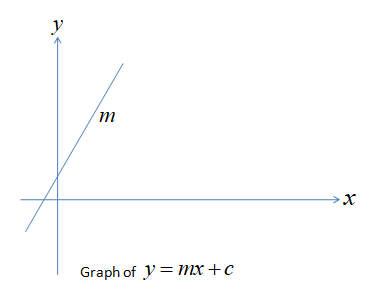
Here we can see the above relation is the same as an equation of a straight line i.e. y=mx+c
where, m is the slope. c is the value of y when x=0, is called the intercept.
The graph according to this equation (y=mx+c) is :
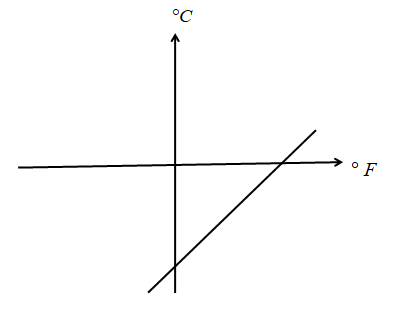
We get the relation of Celcius and Fahrenheit, ⇒C=95F−9160
Hence, by equating with y=mx+c
y=C
m=95
x=F
c=−9160
Since, the value of the slope is positive and the intercept is negative, the graph will be like,
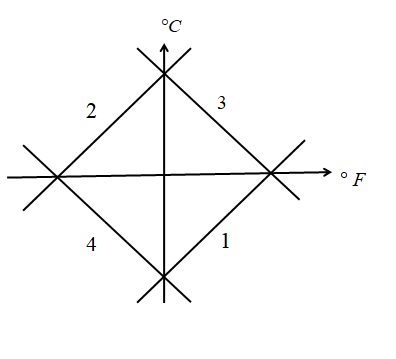
The given figure in problem is,

If we consider the nature of each straight line w.r.t the numberings, it is remarked that the straight lines are similar to the above graph of y=mx+c
Where, ∘C denotes in yaxis, ∘F denotes in x axis.
In the figure,
curve-1: the slope is positive and the intercept is negative.
curve-2: the slope is positive and the intercept is positive.
curve-3: the slope is negative and the intercept is positive.
curve-4: the slope is negative and the intercept is negative.
So the curve for the relation between Celcius and Fahrenheit is the curve-1.
Note: There are three scales for measuring temperature: Celsius, Fahrenheit, and Kelvin.
On the Celsius scale, the freezing point of water is 0 degrees celsius and the boiling point is 100 degrees celsius The unit of temperature on this scale is the degree Celsius.
Fahrenheit temperature scale is based on 32 for the freezing point of water and 212 for the boiling point of water, the gap between the two scales is divided into 180 sections.
In the Kelvin scale, the lower standard point is 273K and the upper-lower standard point is 373K.