Question
Question: Which of the curves in the figure represents the relation between Celsius and Fahrenheit temperature...
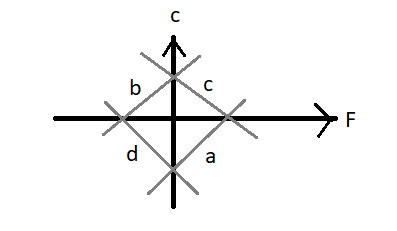
Which of the curves in the figure represents the relation between Celsius and Fahrenheit temperature?
(A) Curve a
(B)Curve b
(C)Curve c
(D)Curve d
Solution
Hint : Here, we’ll proceed by writing down the relation between Celsius and Fahrenheit temperature scales. After that, compare this equation with the general equation of a straight line. Then we will calculate the slope using those two equations and see which slopes in the diagram match it.
Formula used:
F=59×C+32
y=mx+c
m denotes the slope of the straight line and c denotes the intercept of the straight line on the y-axis
Complete step-by-step solution:
According to the relation between Celsius and Fahrenheit temperature scales, we get
F=59×C+32−−−−−−(1)
We all know that the general equation of any straight line is given by
y=mx+c−−−−−−(2)
Where m denotes the slope of the straight line and c denotes the intercept of the straight line on the y-axis
Since in the given figure, it’s clear that the x-axis corresponds to the Fahrenheit temperature scale and therefore the y-axis corresponds to the Celsius temperature scale
By rearranging the equation (1), we get
⇒F−32=59×C
⇒C=95×(F−32)
⇒C=(95)F−95×32
C=(95)F−9160.−−−−−−(3)
By comparing equation (2) with equation (3), we can say that the relation between the Celsius and Fahrenheit temperature is a straight line having a slope of 95 and y-intercept as9−160. This suggests that the straight line representing the relation between the Celsius and Fahrenheit temperature has a positive slope and negative intercept. Therefore, the specified curve representing the relation between Celsius and Fahrenheit is curve a which is lying within the fourth quadrant.
So, the correct answer is “Option A”.
Note: In this particular problem, it’s important to know the various characteristics of the straight lines lying in the figure given. The curve a lying in the fourth quadrant have the positive slope and negative intercept, the curve b lying in the second quadrant have a positive slope and positive intercept, the curve c lying in the first quadrant has a negative slope and positive intercept, and the curve d lying in the third quadrant have a negative slope and negative intercept.