Question
Question: Which graph displays data in top-to-bottom fashion? A. Stacked Vertical bar B. Horizontal Bar ...
Which graph displays data in top-to-bottom fashion?
A. Stacked Vertical bar
B. Horizontal Bar
C. Stacked Horizontal bar
D. Vertical Bar
Solution
Well we can say that graphs are used to visually represent data relationships. We can use the graph if the data shows clear patterns or indicates relationships between variables. Bar graphs or bar charts are used in a pictorial representation of grouped data.
Complete step by step answer:
We know that,
In the bar chart, the data points in a collection of data are shown by spaced rectangular bars. Also, in a bar chart, the rectangular bars are typically arranged vertically or horizontally.
There are different types of bar:-
Vertical Bar Chart: The data is represented along the y-axis of the graph, and the height of the bars shows the values.
Horizontal Bar Chart: The data is shown along the x-axis of the graph, and the length of the bars denote the values.
Grouped Bar Chart: Here, a single colour is used to represent the specific series across the set. This graph can be represented using both vertical and horizontal bar charts.
Stacked Bar Chart: Each bar represents the whole and each segment represents the different parts of the whole.
In short, the graphs give a visual display for comparing quantities in different categories. The bar graphs have two lines i.e. horizontal and vertical axis, also called the x-axis and y-axis respectively, along with the title, labels, and scale range. They are normally used to show the time series data or other forms of data to easily identify the information available in it.
Thus, the rectangular bars of the bar charts are vertically drawn on the x-axis, and the y-axis shows the value of the height of the rectangular bars which represents the quantity of the variables written on the x-axis. We will take one example to show the graphs of all the four bar charts as below:
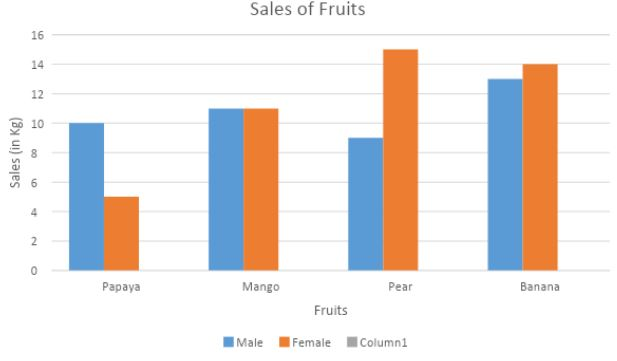
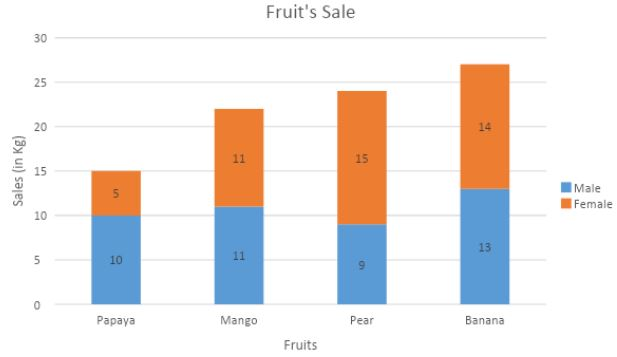
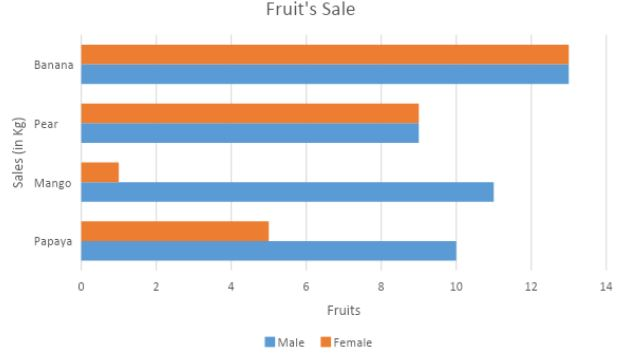
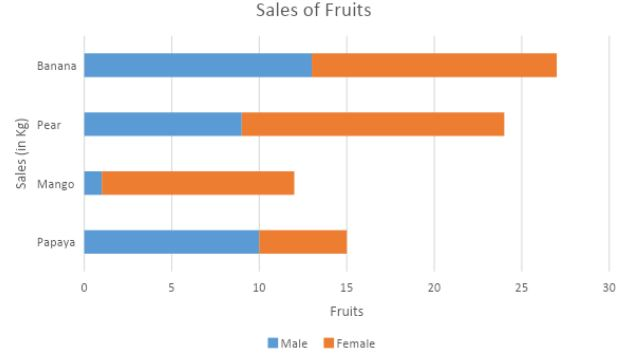
| Sales (in Kg) | Papaya | Mango | Pear | Banana |
|---|---|---|---|---|
| Fruits eaten by Male | 10 | 11 | 9 | 13 |
| Fruits eaten by Female | 5 | 11 | 15 | 14 |
Vertical Bar graph:
Stacked Vertical Bar Graph:
Horizontal Bar graph:
Stacked Horizontal Bar Graph:
Hence, the vertical bar graph displays data in top-to-bottom fashion.
Note: In a bar graph, we use bars of different heights, to basically a graphical representation of data. In real life, to represent business data we use bar graphs. Bar graphs are an excellent tool when representing data that are independent of one another and don’t need to be in any specific order while being represented.