Question
Question: When \(n\) is small (less than \(30\) ), how does the shape of the \(t\) distribution compare to the...
When n is small (less than 30 ), how does the shape of the t distribution compare to the normal distribution?
Solution
Here in this question we have been asked to compare the shape of the t distribution with that of the normal distribution, when n is small (less than 30 ). We know that t distribution is a type of probability distribution that is similar to the normal distribution and it has a greater chance for extreme values than normal distribution.
Complete step-by-step answer:
Now considering from the question we have been asked to compare the shape of the t distribution with that of the normal distribution, when n is small (less than 30 ).
We know that t distribution is a type of probability distribution that is similar to the normal distribution and it has a greater chance for extreme values than normal distribution.
Here a diagram is shown for t distributions of different degrees and normal distribution in a single plot so that we can compare them easily. Observe them carefully and draw the required conclusions.
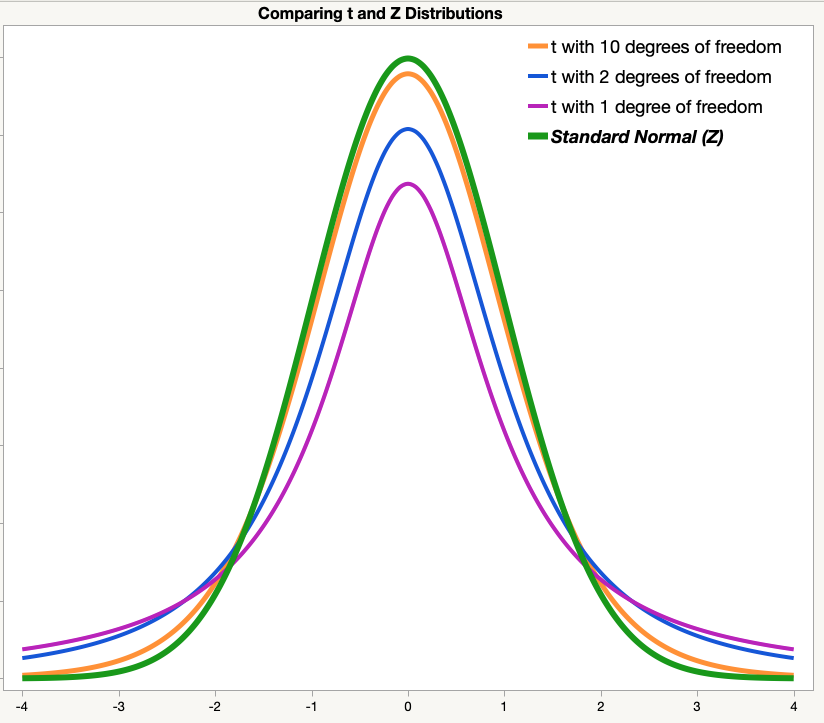
Hence we can conclude that when n is small (less than 30 ), the shape of the t distribution will be flatter and more spread out when compared to the normal distribution.
Note: In questions of this type we should be sure with the concepts that we are applying in between the steps during the process of answering. This is a pure concept based question and it is clearly derived from the concepts of statistics.