Question
Question: When a thin metal wire is stretched, it becomes longer and thinner. This causes a change in the resi...
When a thin metal wire is stretched, it becomes longer and thinner. This causes a change in the resistance of the wire. The volume of the wire remains constant. Which graph could represent the variation with extension x of the resistance R of the wire?
A.
B.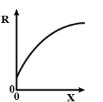
C.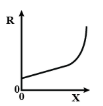
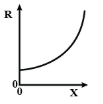
D.
Solution
First establish a proportionality relation between length and area of cross-section. Now describe the proportionality relation between resistance, length and area of cross-section. Now use both these relations to figure out the graph.
Complete answer:
Let the length of the wire before and after stretching be L1 and L2 respectively. Also let the area of cross-section of the wire before and after stretching be A1 and A2 respectively.
Now, we know that the volume of the wire remains constant on stretching, so
L1A1=L2A2=Volume of the wire
⇒A2=L2L1A1
⇒A2∝L21
So, area of cross-section decreases as the length increases
Now, we know that
R∝L,
R∝A1,
And R∝AL
⇒R=ρL1A1L2L2
⇒R=ρL1A1(L2)2
⇒R∝(L2)2
So, there is an exponential increase in resistance with increase in length.
The graph of exponential growth look like this
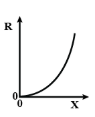
But we know even before stretching the wire, it has some initial resistance, so the graph becomes like this
So, the option A is the correct choice.
Note:
The resistance of the wire changes on increase in the length, because increase in length of the wire means that there will be more collisions between the electrons as it passes through the wire. Another reason is that with increase in length there is a decrease A in area of cross-section, which leaves a narrower path for electrons to move in, hence increasing collisions and resistance.