Question
Question: What is the shape of the graph \[{{r}^{2}}=-\cos \theta \]?...
What is the shape of the graph r2=−cosθ?
Solution
For solving this question you should know about the graph of −cosθ and the range of this graph. And in this question if we find the range of −cosθ then it will be 2π to 23π. And if we plot the graph for this then it becomes a loop and the reason for the loop is because the values of −cosθ will always vary within the range of -1 to 1. And thus we get a looped shape for this.
Complete step by step answer:
According to our question we have to find the shape of the graph of r2=−cosθ.
If we want to make a graph for r2=−cosθ, then first we will find the range of −cosθ.
If we see the graph of cosθ, then:
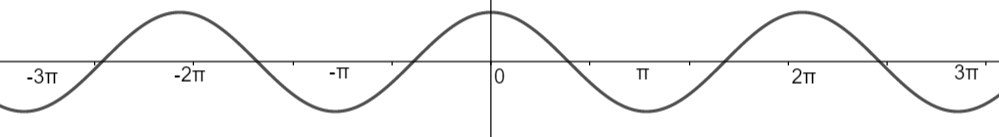
So, the range of cosine function is -1 to 1.
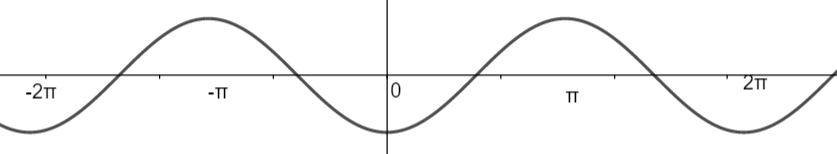
If we see to −cosθ then the range of −cosθ is −1≤−cosθ≤1 and the domain is \left( -\infty ,\infty \right),\left\\{ \theta |\theta \in R \right\\}.
So, the graph of −cosθ is:
As per question r2=−cosθ, so the shape will be symmetrical about the initial line and r2=−cosθ≥0,θ∈(2π,23π), where cosθ≤0.
So, here if we see the value of −cosθ at different angles then:
At 2π:−cosθ=0;(0,2π)
At 32π:−cosθ=21:(21,32π)
At 43π:−cosθ=21;(21,43π)
At 65π:−cosθ=23;(23,65π)
At π:−cosθ=1;(1,π)
Symmetry about the axis θ=π will be used to draw the other half of the loop.
We considered only r=−cosθ≥θ for making the loop we did not consider the non – positive r=−cosθ≤θ, for the opposite loop, for the same θ∈(2π,23π).
So, here the r is a single values function of θ.
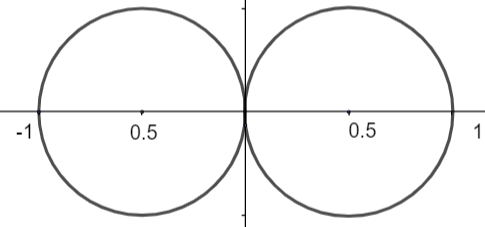
So, the shape of r2=(−cosθ) is a looped shape.
Note: While solving this question you should be careful about the domain and the range of the given function because only these both will decide the graph of a function. And it will provide the shape. And the graph for every function is different from each other, so always draw a fresh new graph.