Question
Question: What is a PV indicator diagram?...
What is a PV indicator diagram?
Solution
In order to solve this question we need to understand the PV indicator diagram. PV indicator diagram is a graph between the pressure and volume of a system. PV indicator is commonly used in thermodynamics, cardiovascular physiology, and respiratory physiology. The p-v diagram is originally called indicator diagram.
Complete answer:
Indicator diagram (P-V diagram) A curve showing variation of volume of a substance taken along the X-axis and the variation of pressure taken along Y-axis is called an indicator diagram or P-V diagram. The shape of the indicator diagram shall depend on the nature of the thermodynamic process the system undergoes.
A curve showing variation of volume of a substance taken along the X-axis and the variation of pressure taken along Y-axis is called an indicator diagram or P-V diagram. The shape of the indicator diagram shall depend on the nature of the thermodynamic process the system undergoes.
Let us consider one mole of an ideal gas enclosed in a cylinder fitted with a perfectly frictionless piston.
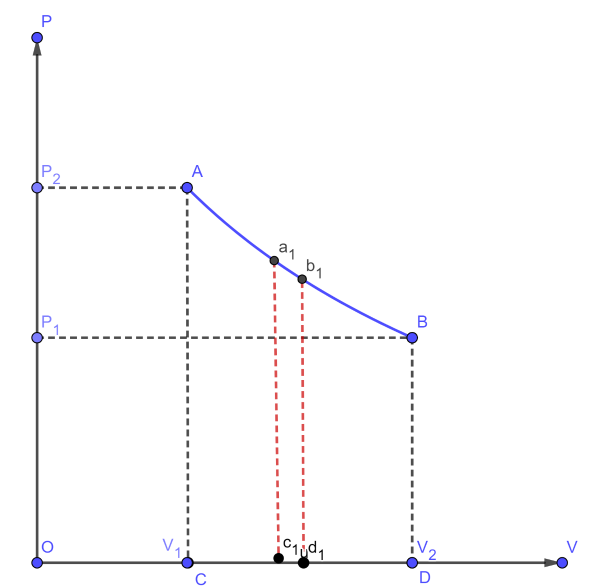
Let, P1, V1 and T be the initial state of the gas. If dV is an infinitesimally small increase in volume of the gas during which the pressure P is assumed to be constant, then small amount of work done by the gas is dW=PdV
In the indicator diagram,
dW=area a1b1c1d1
The total work done by the gas during expansion from V1 and V2 is,
W=v1∫v2PdV= Area ABCD, in the indicator diagram
Hence, in an indicator diagram the area under the curve represents the work done.
Note:
It should be remembered that the p-v diagram is originally called indicator diagram. The pressure and volume diagram are used to describe corresponding changes in a system. The pressure and volume diagram are used to estimate the net work performed by a thermodynamic cycle. The total area under the curve on a PV diagram, is we can find the work done by determining.