Question
Question: What does sine curve mean?...
What does sine curve mean?
Solution
Hint : Here you have to explain the graph of the sine curve and try explaining why the shape of it is the way it is. Explain the domain and range of the function and how that affects the curve and its characteristics and compare it to other curves such as cosine.
Complete step-by-step answer :
Sine Curve – Here is how the sine curve first looks like. It is represented by the equation y=sinx .
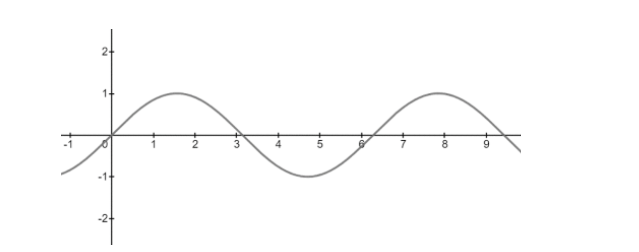
A sine curve is a function which always starts at 0∘ and is a periodic function which repeats itself after 2π . This means that after 2π it gives us the same value we got at 0∘ and it continues till the next 2π part of the curve. The sin curve starts at 0 on the y axis and 0∘ on the x axis. It then continues till it reaches 1 on y axis when we are at 90∘ or 2π (as we can say in radians) on the x axis. After that sin curve starts decreasing again till we reach 0 on y axis while being at 180∘ or π on x axis. The function keeps decreasing until we reach −1 on the y axis at 23π on the x axis. After that the function starts increasing again till reaching 0 on y axis when being at 2π at x axis. After 2π the function is periodic which we can expressed as
sin(θ)=sin(θ+2π)
The sine function and cosine has the phase difference of 2π with each other the cosine function being 2π ahead when it comes in comparison to sine function. Both the graphs meet each other at 4π and 45π .
Note : This graph of sine is used in technical analysis and when we trade we can use it to identify patterns and crossover when it comes to oscillators. Sine curves are also used to represent the oscillations of particles in physics.