Question
Question: We Using the \(x\)-intercept and \(y\)-intercept, how do you graph \(2x-3y=5\)?...
We Using the x-intercept and y-intercept, how do you graph 2x−3y=5?
Solution
In this question we will first convert the given linear expression in the general form of the equation of a line which is y=mx+b, where b is the y intercept and m is the slope of the line, and then solve for the values for the x intercept and the y intercept to plot the line on the graph.
Complete step-by-step answer:
We have the expression as 2x−3y=5
We will first convert this expression to the slope intercept form of a line which is y=mx+b.
⇒2x−3y=5
On transferring the term 2x from the left-hand side to the right-hand side, we get:
⇒−3y=5−2x
Now on multiplying both the sides of the expression by −1, we get:
⇒3y=−5+2x
The right-hand side can be rearranged and written as:
⇒3y=2x−5
On transferring the term 3 from the left-hand side to the right-hand side, we get:
⇒y=32x−5
On splitting the denominator, we get:
⇒y=32x−35
Therefore, the above equation is in the form of y=mx+b
From the general format, we know that b is the y intercept of the line therefore y=−35
Now to calculate the x intercept from the equation we will substitute y=0 and solve for x.
On substituting y=0, we get:
⇒0=32x−35
On transferring 35 from the right-hand side to the left-hand side and rearranging the terms, we get:
⇒32x=35
On simplifying, we get:
⇒2x=5
On transferring 2 from the left-hand side to the right-hand side, we get:
⇒x=25
Which can be simplified as:
⇒x=2.5, which is the x intercept.
On plotting the graph by taking the two points as (0,−1.66) and (2.5,0), we get:
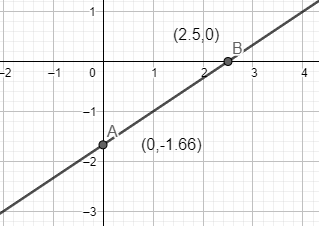
Which is the required solution.
Note: Slope of a line is calculated as the ratio between the vertical change and the horizontal change. It can be also defined as how much the change in one intercept will affect the change in another intercept.
It can be calculated using the formula m=x2−x1y2−y1 where (x1,y1) coordinates of first line and (x2,y2) are the coordinates of the second line.