Question
Question: Volume versus temperature graphs for a given mass of an ideal gas are shown in figure at different v...
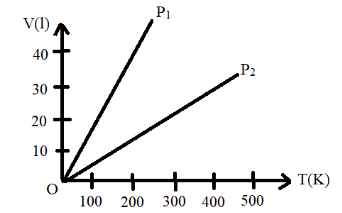
Volume versus temperature graphs for a given mass of an ideal gas are shown in figure at different values of constant pressure. What can be inferred about the relation between P1 and P2 ?
(A) P1>P2
(B) P1=P2
(C) P1<P2
(D) Data is insufficient
Solution
The ideal gas concept and the equation used to represent its concept needs to be applied in order to find out the relation between the two graphs. The relationship between the change in volume with temperature and the pressures which for the two cases needs to be analyzed in order to determine the required relation between P1 and P2 .
Complete Step By Step Answer:
The above problem revolves around the concept of ideal gases and the equation that represents the relationship between the various physical quantities that govern the ideal gases like pressure, volume and temperature. In order to find the relationship between the two pressure values of the two gases we first need to know the concept behind ideal gases.
Ideal gases are said to be the gases in which the intermolecular forces between the molecules are almost negligible and are said to be gases that obey the ideal gas equation. The ideal gas equation is an equation that describes the state of any gas and is derived from the three laws namely, Charles' law, Boyles’ law and Avogadro's law. Thus, an ideal gas obeys all of these equations. The ideal gas equation is given as:
PV=nRT
Where,
P is the pressure of the gas
V is the volume of the gas
n is the number of moles
R is the universal gas constant
T is the temperature
From the ideal gas equation, by rearranging the terms we obtain:
V=PnRT -----------( 1 )
From the Charles’ law equation we know that:
VαT
Charles' law describes the relationship between volume and temperature and states that the volume of a fixed mass of a gas is directly proportional to its absolute temperature keeping the pressure constant. It is mentioned that the pressure is maintained to be constant and the graphs for the two separate gases varying the volume and temperature are drawn as given in the figure. Thus, Charles’ law will apply in this case as well and hence by applying it we get:
T1V1=constant
By comparing the equation ( 1 ) and the above equation we can apply Charles’s law and since pressure, number of moles and the gas constant R are all constants we get:
TV=PnR
By varying the volume with respect to the temperature quantity we get:
dTdV=PnR
From the above equation it can be clearly seen that that the term dTdV is inversely proportional to the pressure P because with an increase in volume with temperature then the pressure decreases and hence we obtain the relation:
dTdVαP1
Thus, from the graphs we can see that the slope of the first graph that is the graph representing the gas with pressure P1 has a smaller slope as it is more steeper and hence the relation between P1 and P2 is as follows:
P1>P2
Therefore, the correct option is option A).
Note:
Even-though the ideal gas equations are analyzed and have been derived, the ideal gas concept is rather hypothetical. The ideal gas equation is also known as a state equation because it gives the relation between the various states of the gas. Each line of the volume versus temperature graph is known as an isobar.