Question
Question: Volume versus temperature graph of two moles of helium gas is as shown in figure. The ratio of heat ...
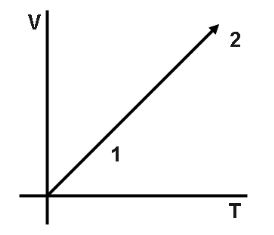
Volume versus temperature graph of two moles of helium gas is as shown in figure. The ratio of heat absorbed and the work done by the gas in process 1−2 is.
A. 3
B. 25
C. 35
D. 27
Solution
To solve this question, we will directly use the specific heat at a constant pressure of monatomic gas and substitute the same value in the equation of heat absorbed. Then we will simply divide the equation with the equation of the work done in the case of the isobaric process to get the required solution
Formula used:
△U=nCv△T
⇒△Q=nCp△T
Where, n is the number of moles, Cp is the heat at constant pressure, Cv is the molar heat capacity and △T is the change in temperature.
Complete step by step answer:
Since, V∝T is a straight line. Therefore, we can say that, P is constant. And here it is given, n=2 and He is a monatomic gas.
As △Q=nCp△T ,
△U=nCv△T
Also,
△W=△Q−△U ⇒△W=μ(Cp−Cv)△T
Therefore, required ratio is,
△W△Q=n(Cp−Cv)△TnCp△T ⇒△W△Q=Cp−CvCp
Further we can write,