Question
Question: Velocity-time (v-t) graph for a moving object is shown in the figure. Total displacement of the obje...
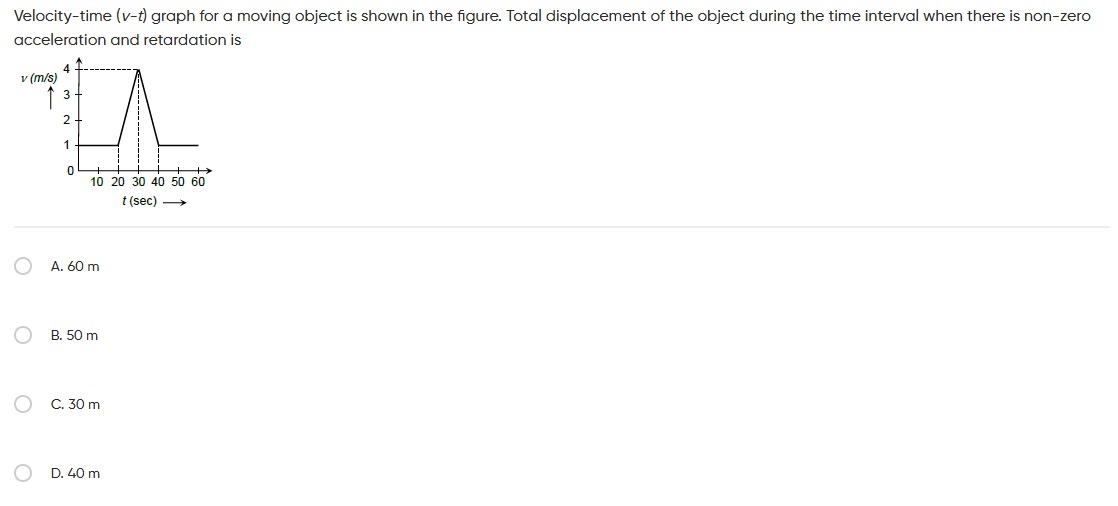
Velocity-time (v-t) graph for a moving object is shown in the figure. Total displacement of the object during the time interval when there is non-zero acceleration and retardation is
60 m
50 m
30 m
40 m
50 m
Solution
The displacement of an object from a velocity-time (v-t) graph is given by the area under the graph. Acceleration is given by the slope of the v-t graph.
- A positive slope indicates acceleration.
- A negative slope indicates retardation (deceleration).
- A zero slope (horizontal line) indicates zero acceleration (constant velocity).
We need to find the total displacement during the time intervals when there is non-zero acceleration and retardation.
Let's analyze the graph segments:
-
From t = 0 s to t = 20 s: The velocity is constant at 1 m/s. The slope is zero, so acceleration is zero. This interval is not included.
-
From t = 20 s to t = 30 s: The velocity increases linearly from 1 m/s to 4 m/s. The slope is positive, indicating non-zero acceleration. This segment forms a trapezium.
Displacement (S1) = Area of trapezium = 21×(sum of parallel sides)×height
S1=21×(1 m/s+4 m/s)×(30 s−20 s)
S1=21×(5 m/s)×(10 s)
S1=25 m
-
From t = 30 s to t = 40 s: The velocity decreases linearly from 4 m/s to 1 m/s. The slope is negative, indicating non-zero retardation. This segment also forms a trapezium.
Displacement (S2) = Area of trapezium = 21×(sum of parallel sides)×height
S2=21×(4 m/s+1 m/s)×(40 s−30 s)
S2=21×(5 m/s)×(10 s)
S2=25 m
-
From t = 40 s to t = 60 s: The velocity is constant at 1 m/s. The slope is zero, so acceleration is zero. This interval is not included.
The total displacement of the object during the time interval when there is non-zero acceleration and retardation is the sum of the displacements from 20 s to 30 s and from 30 s to 40 s.
Total Displacement = S1+S2=25 m+25 m=50 m