Question
Question: Variation with atmospheric pressure above the sea level is graphically shown with (temperature of th...
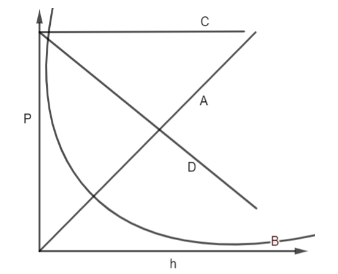
Variation with atmospheric pressure above the sea level is graphically shown with (temperature of the atmosphere is assumed to be constant here)
A. C
B. D
C. A
D. B
Solution
To solve this question we need to find the variation of pressure with increasing altitude assuming that the temperature of the atmosphere remains constant. We need to recall the pressure variation in the atmosphere.
Complete step by step answer:
The atmospheric pressure varies with the increasing altitude as the density of air decreases as we rise above the sea level and the air becomes rarer. Pressure decreases with increasing altitude. The pressure at any level in the atmosphere may be interpreted as the total weight of the air above a unit area at any given elevation.
At higher elevations, the air is less dense above a given surface than a similar surface at lower elevations. Therefore atmospheric pressure decreases as we go up above the sea level but we still don’t know the exact variation.We will now look at the pressure variation formula to know the exact trend of its with increasing altitude
P=PoeKT−mgh
Where P is the atmospheric pressure, Po is the average sea-level atmospheric pressure. m is the molar mass of earth’s air, g is gravitational acceleration, h is the height, T is standard temperature and R is the universal gas constant.
From the above formula, we can see that the atmospheric pressure varies exponentially therefore curve B given in the question graph is correct.
Hence, the correct option is D.
Note: The atmospheric pressure is the pressure exerted by the weight of the atmosphere, which at sea level has a value of 101,325kPa ( value of Po ). It should be noted that the pressure variation formula is also known as the barometric formula. Barometers are used to measure pressure in millibars.