Question
Question: Two identical positive charges are placed on the \(y\) axis at \(y=-a\) and \(y=+a\). The variation ...
Two identical positive charges are placed on the y axis at y=−a and y=+a. The variation of V (electric potential) along x axis is shown by graph:
A.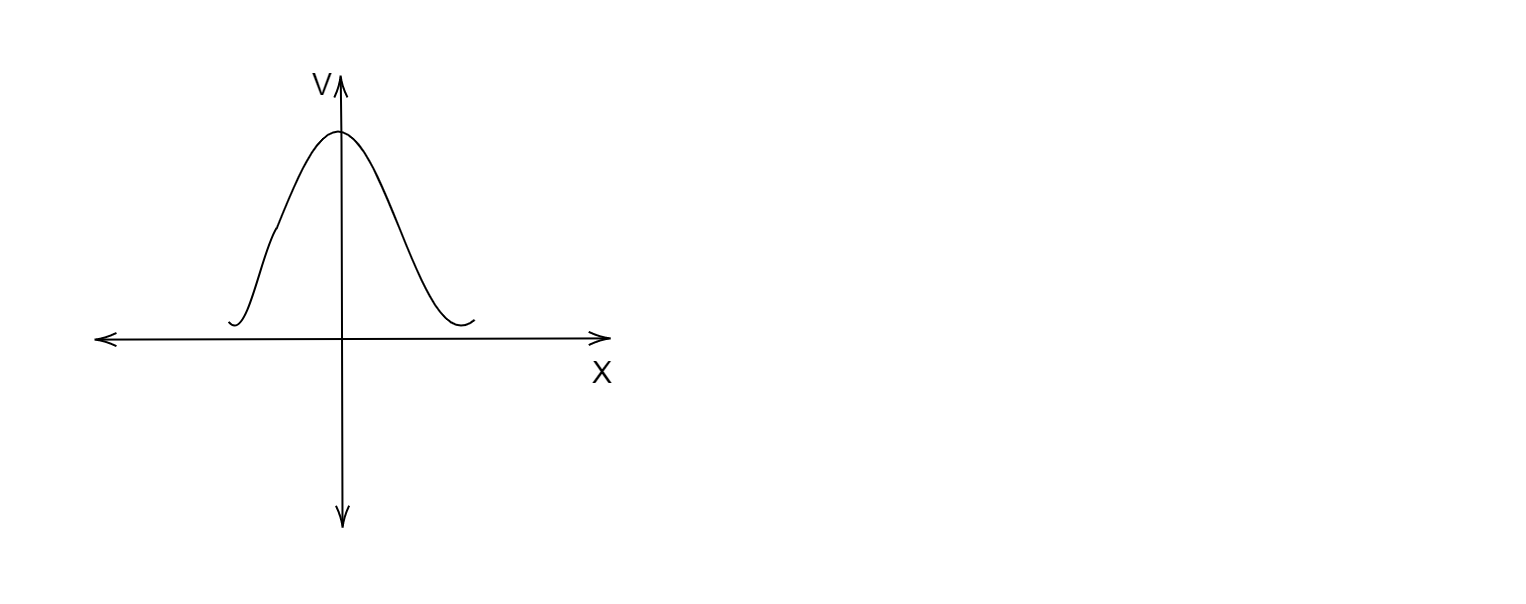
B.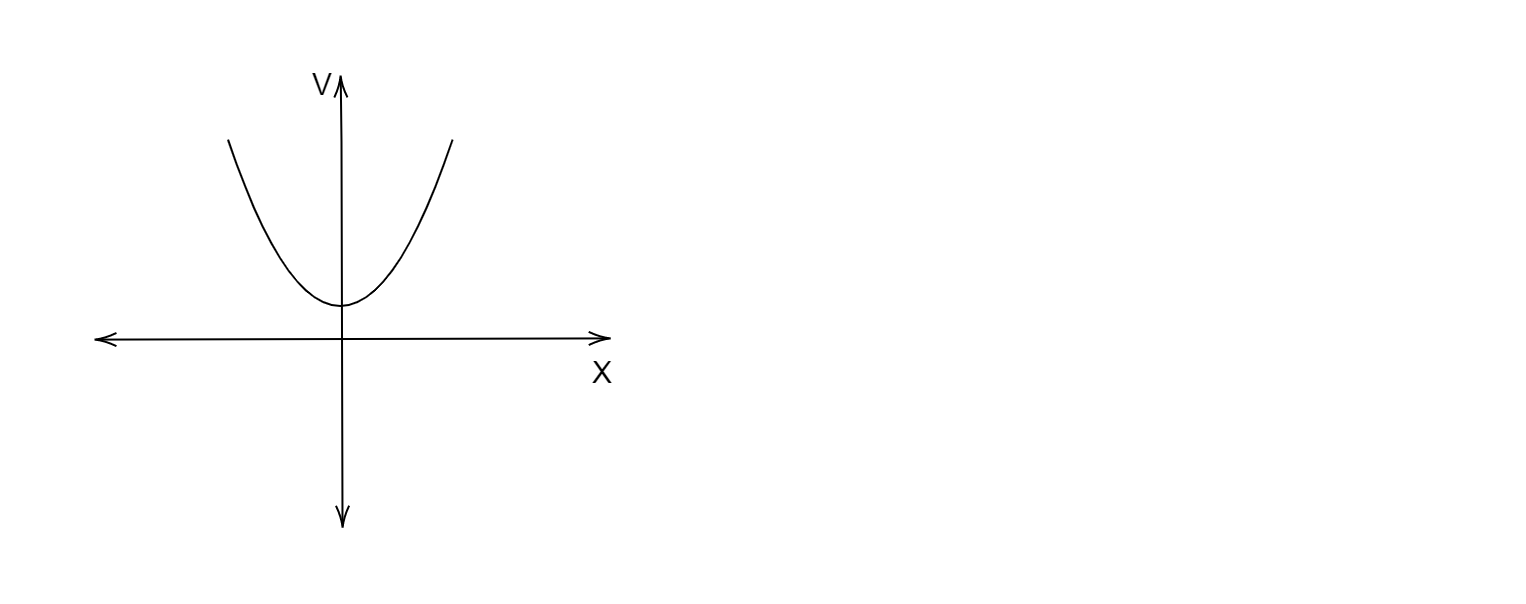
C.
D.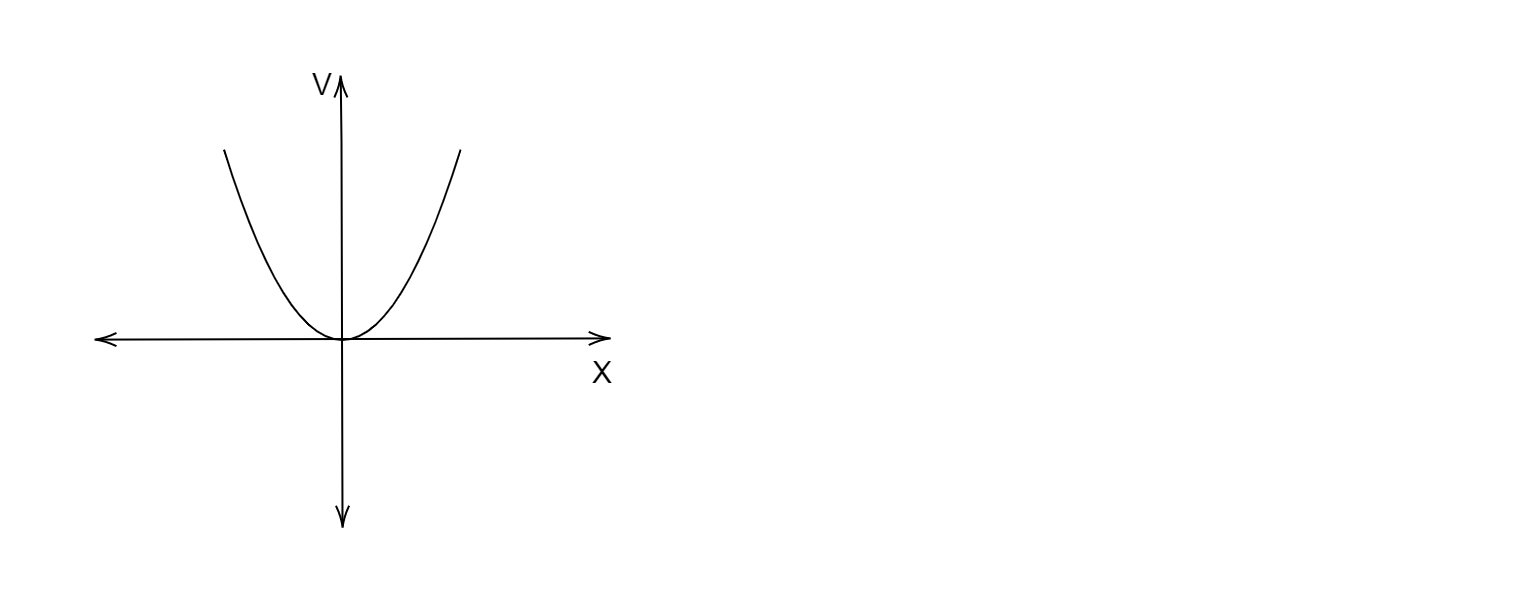
Solution
To know about the variation of electric potential along the x axis can be found out by calculating electric potential at different points on the x axis. We can calculate the electric potential at a random point on the x axis first and then use it to find the variation of electric potential.
Complete answer:
Let us first consider a random point on the x axis. Let the random point at which we will find the electric potential be at the point (x,0) and let us call it P.
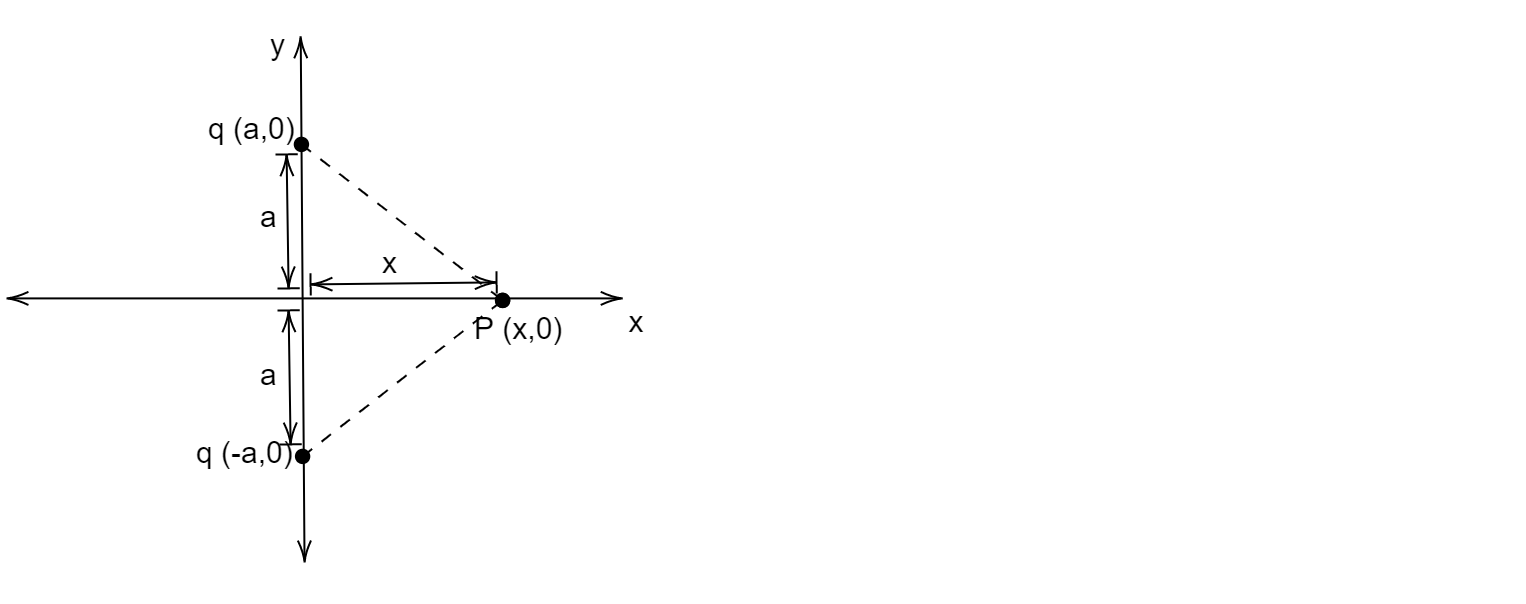
The distance d of the point P from the two identical positive charges can be found out by Pythagorean theorem:
d=a2+x2
The electric potential at point P due to the positive charge placed at y=−a will be:
V1=a2+x2kq
The electric potential at point P due to the positive charge placed at y=+a will be:
V2=a2+x2kq
The total electric potential at point P due to both the positive charges will be:
Vtotal=V1+V2Vtotal=a2+x2kq+a2+x2kqVtotal=a2+x22kq
At origin, when x=0, the total electric potential will be:
Vtotal=a2+022kqVtotal=a22kqVtotal=a2kq
When x→∞, the total electric potential will be:
Vtotal=a2+x22kqVtotal=xx2a2+x2x22kqVtotal=x0+12kqVtotal=x2kqVtotal→0
Now we need to find the graph that matches the value of the electric potential that we found out for electric potential at x=0 and x→∞. If we observe carefully, then graph A acquires a maximum value at x=0 and a minimum value at x→∞.
Therefore, the correct option is A.
Note:
Students might get confused between option A and option C but we must also see that the electric potential is inversely proportional to the distance on x axis, therefore the graph must be a rectangular hyperbola, thus option A must be correct.