Question
Question: Two cars are travelling on a straight road. The car \({{\text{C}}_1}\) is going at a constant speed ...
Two cars are travelling on a straight road. The car C1 is going at a constant speed of 9ms−1 . 40m ahead of C1 is the car C2 at rest, but starts moving with an acceleration of 1ms−2.
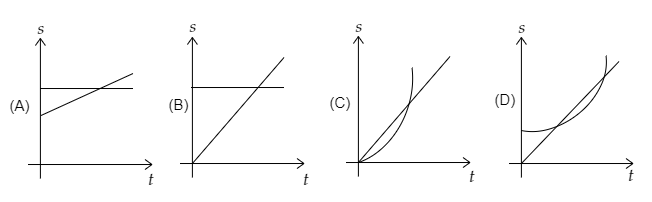
Which of the following graphs correctly represent the position of the two cars with time w.r.t the initial position of C1 ?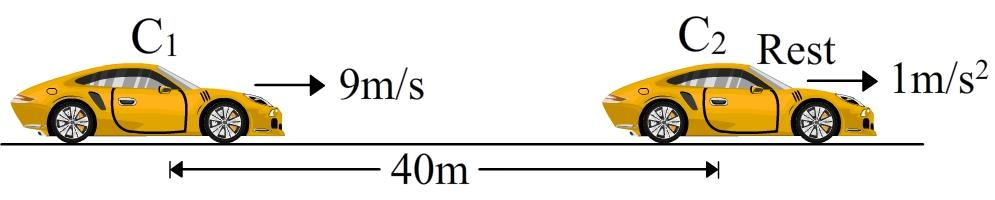
Solution
Here we can first obtain an equation for the distance s covered by each car for the same time using Newton’s first equation of motion which is a relation connecting the distance covered by the car, the time taken, its initial velocity and its acceleration. Then based on these obtained equations we can sketch the required position versus time graph for the two cars. The required position-time graph is the one with respect to the initial position of C1 .
Formula used:
Newton’s first equation of motion gives the distance covered by a body as s=ut+21at2 where u is the initial velocity of the body, t is the time taken and a is the acceleration of the body.
Complete step by step solution:
List the known parameters of the two cars C1 and C2.
The initial constant velocity of the car C1 is given to be u1=9ms−1.
Since the car C2 is at rest initially, its initial velocity will be zero i.e, u2=0 .
The acceleration of the car C2 is given to be a2=1ms−2.
The distance of separation between the two cars is given to be 40m .
Let s1 and s2 be the distance covered by cars C1 and C2 respectively in time t.
Using Newton’s first equation of motion, express the distance covered by the two cars in a time t.
Newton’s first equation of motion gives the distance covered by car C1 as
s1=u1t=9t
Thus the equation for the position of the car C1 is obtained as s1=9t -------- (1)
Equation (1) represents a straight line. So the position versus time graph of C1 w.r.t its initial position will be a straight line.
Now Newton’s first equation of motion gives the distance covered by car C2 as
s2=u2t+21a2t2=2t2
Thus the equation for the position of the car C2 is obtained as s2=2t2 . However, when the car C1 was in motion C2 remained at rest till the distance between the two cars was 40m . So when we consider the position of C2 w.r.t the initial position of C1 we have to take into account this initial distance of separation between the two cars.
Thus the equation for the position of the car C2 w.r.t the initial position of C1 will be
s21=2t2+40 --------- (2)
Equation (2) represents a parabola.
So the position-time graph for the two cars w.r.t the initial position of C1 will take the form given below.
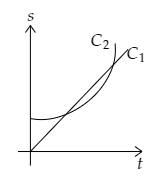
So the correct option is D.
Note: Here the car C1 is mentioned to be travelling at a constant speed. So its acceleration will be zero i.e., a1=0 . Thus we obtain the distance covered as that given by equation (1). In equation (1) when t=0s we have s1=0m . So the straight line representing the position of C1 will start at the origin. In equation (2), when t=0s we have s21=40m so the parabola representing the position of C2 will not start at the origin.