Question
Question: The volume-temperature graph of a given mass of an ideal gas at constant pressure is shown in the fi...
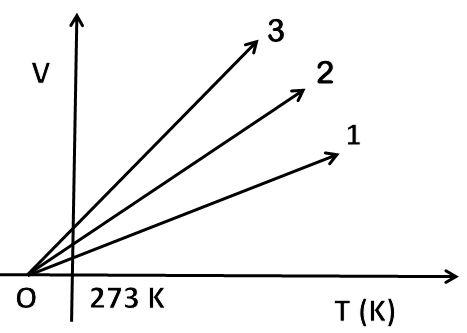
The volume-temperature graph of a given mass of an ideal gas at constant pressure is shown in the figure. Which graph (out of 1,2 or 3) will correspond to the highest pressure?
Solution
We know that the ideal gas equation is PV=nRT. When we deal with volume-temperature graphs, actually we are taking volume and temperature as variables taking other terms constant. This is what is called Charles' Law. Here, we have to take temperature in absolute values (in Kelvin) to obtain the required graph.
Complete step by step answer:
When the pressure of the gas molecules and amount of gas is taken as constant, the Kelvin temperature is directly proportional to the volume. It is found that each degree rise in temperature, volume of gas increases by 273.151 of the original volume of gas at 0oC.
This relationship can be written as: Vt=Vo+273.15tVo; where Vt is the volume of gas at toC and Vo is the volume of gas at 0oC.
In absolute temperature or Kelvin temperature scale, Tt=273.15+t and To=273.15. The relation is transformed to Vt=Vo(ToTt) or VoVt=ToTt.
So, the general equation is T1V1=T2V2. It means TV=constant, this constant value is pressure of gas and moles. According to ideal gas, the relation is V = PnR×T. The volume-temperature graph is a straight line with an intercept on the x-axis at −273.15 K. Slopes at different pressures are different. More is the slope of the line, less will be the pressure of gas as slope∝P1. Line 3 has the greatest slope, so it will correspond to least pressure. So, the correct answer is “Line 1”.
Note: As the pressure is constant, the graph is called an isobar. All the gases follow Charles’ law at very low pressures and high temperatures. At absolute temperature at T =0 K, the volume of gases is zero. It is because no gas tends to exist at that temperature. This is actually a hypothetical situation as gases liquefy before this temperature is reached.