Question
Question: The voltage time (V-t) graph for triangular waves having peak value \({V}_{0}\) is as shown in figur...
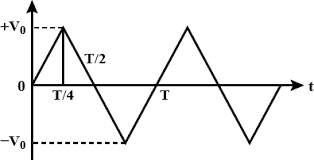
The voltage time (V-t) graph for triangular waves having peak value V0 is as shown in figure. The rms value of V in time interval from t=0 to 4T is:
A. 3V0
B. 2V0
C. 2V0
D. None of these
Solution
We have to calculate rms value of voltage. As the name itself explains, rms voltage is calculated by taking the square root of the mean average of the square of the voltage in an appropriately chosen time interval which is already mentioned in the question. Substitute the values in the rms formula and calculate the rms value of V in a time interval from t=0 to 4T.
Complete step by step answer:
Given: Peak value of the triangular wave is V0
For t=0 to 4T,
tV=4T−0V0−0
⇒tV=4TV0
⇒V=T04V0t
RMS value is given by,
Vrms=T∫0TV2dt
Substituting the values in above equation we get,
Vrms=4T∫04T(T4V0t)2dt
⇒Vrms=4TT216V02∫04Tt2dt
⇒Vrms=T364V02∫04Tt2dt
⇒Vrms=T364V02∫04T3t3
⇒Vrms=T364V02×31(64T3)
⇒Vrms=3V02
∴Vrms=3V0
Thus, the rms value of V in time interval from t=0 to 4T is 3V0
Hence, the correct answer is option A i.e. 3V0.
Note:
RMS value of a half wave rectifier wave is the least as compared to other waveforms with the same peak value. RMS value for triangular, saw-tooth and sinusoidal waveforms is greater as compared to half-wave rectifiers but lesser than that of the square wave. Square wave has the highest RMS value as compared to all the other waveforms.