Question
Question: The visible region of the hydrogen spectrum was first studied by A) Lyman B) Balmer C) Pfund ...
The visible region of the hydrogen spectrum was first studied by
A) Lyman
B) Balmer
C) Pfund
D) Brackett
Solution
The hydrogen spectrum consists of different sets of spectral lines. The spacing between these spectral lines decreases in a regular way for a specific set. The visible region corresponds to the set of spectral lines having the value of the wavelengths to be that of the visible light. The visible region is named after the scientist who discovered it.
Complete step by step answer.
Step 1: Sketch a figure describing the visible region of the spectrum.
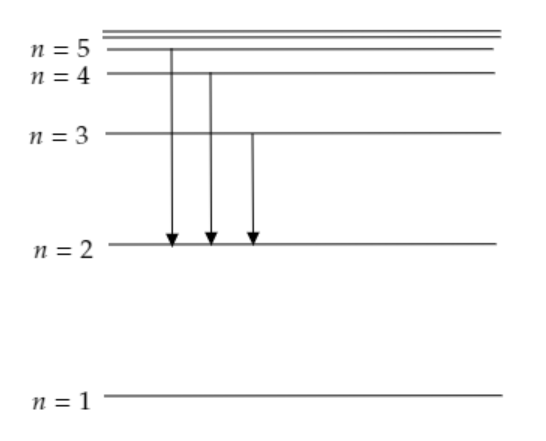
When a hydrogen atom absorbs a photon it gets excited to a higher energy level. When a hydrogen atom undergoes a transition from a higher energy level to a lower energy level, a photon of some wavelength gets emitted. The wavelength of the emitted photon will be in accordance with the energy difference between the higher level and lower level. Only transitions to the level n=2 emit photons having wavelengths in the visible region. This was first studied by Johann Jakob Balmer and the corresponding spectral series is termed as Balmer series.
The figure given below depicts the various transitions to n=2 level for the hydrogen atom.
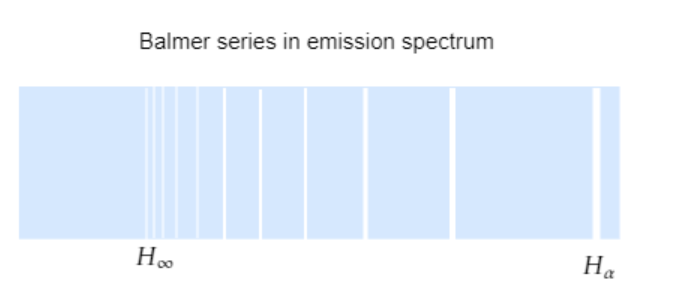
The observed wavelength of the Balmer series is given by, λ1=R(221−n21) where n=3,4,5..... is the principal quantum number and R=1⋅097×107m−1 is the Rydberg constant.
For n=3, we have λ1=1⋅097×107(221−321)=1⋅522×106m−1 or λ=656⋅3nm, this corresponds to red and the line is termed as Hα.
The next lines have wavelengths of the blue-green, violet and so on according to the corresponding transition.
For n=∞, we have λ1=1⋅097×107×221=2⋅7425×106m−1 or λ=364⋅4nm, this corresponds to the shortest wavelength and the line is termed as H∞ .
So the correct option is B.
Additional information: Lyman series corresponds to the transitions between the ground state i.e., n=1 level and successive higher levels. It is the ultraviolet region in the spectrum. Brackett series corresponds to the transitions between the n=4 level and successive higher levels. It is the infrared part of the spectrum. Pfund series corresponds to the transitions between the n=5 level and successive higher levels. It is the far-infrared part of the spectrum.
Note: Hydrogen atom exhibits emission spectra corresponding to the transition from a higher level to a lower level and exhibits absorption spectra corresponding to the transition from a lower level to a higher level. For the Balmer series in the absorption spectra, the transitions are from the n=2 level to different higher levels and the lines appear dark.