Question
Question: The velocity $v$ versus $t$ graph of a body in a straight line is as shown in figure The displacemen...
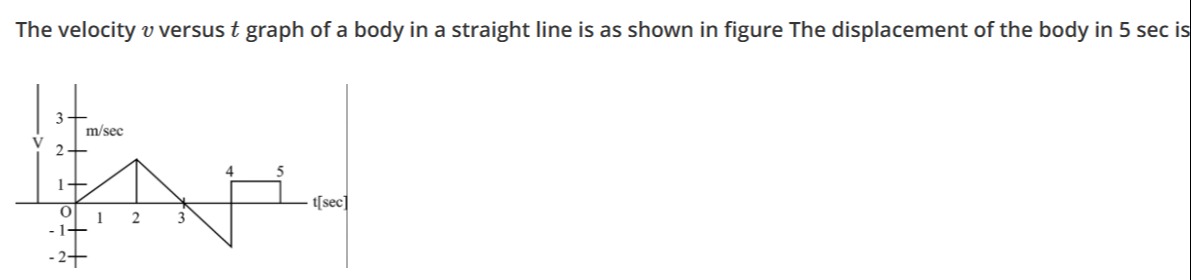
The velocity v versus t graph of a body in a straight line is as shown in figure The displacement of the body in 5 sec is
A
1 m
B
2 m
C
3 m
D
4 m
Answer
3 m
Explanation
Solution
The displacement is the signed area under the velocity-time graph. Area 1 (0-2s): Triangle = 0.5 * 2 * 2 = 2 m Area 2 (2-3s): Triangle = 0.5 * 1 * 2 = 1 m Area 3 (3-4s): Triangle = 0.5 * 1 * (-2) = -1 m Area 4 (4-5s): Rectangle = 1 * 1 = 1 m Total displacement = 2 + 1 - 1 + 1 = 3 m.