Question
Question: The velocity \[v\] versus \(t\) graph of a body in a straight line is as shown in figure. The displa...
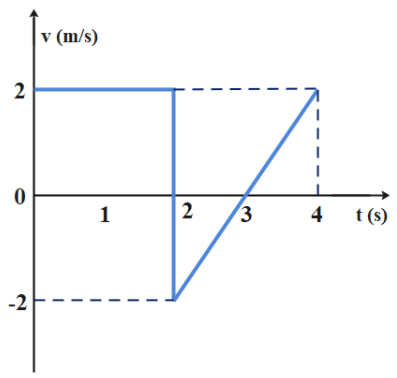
The velocity v versus t graph of a body in a straight line is as shown in figure. The displacement of the body in 4 second is

A. 2m
B. 4m
C. 6m
D. 8m
Solution
The area under the velocity versus time graph will represent the displacement of the particle. In the above figure the area from time 0 second to 2 second is taken as positive. And the area from 2 second to 3 will be taken as negative and the area from 3 second to 4 second will be taken as positive. So the total displacement of the body in 4 seconds will be the sum of all the areas during these 4 seconds.
Complete answer:
From the graph the area under the velocity and time graph from 0 second to 2 second is 2ms−1×2sec=2×2=4m.
So the displacement of the particle in the first two second is 4m.
The area under the velocity and time graph during two to three second is
21×base×height=21×1s×(−2ms−1)=−1m
So the displacement of the particle during two to three second is −1m
The area under the curve during three to four second is
21×base×height=21×1s×(2ms−1)=1m
So the displacement of the particle during three to four second is 1m
The net displacement of the particle is s=4−1+1=4m
So the correct option is B.
Note:
During the area calculation the area above the time axis is taken positive and the area below the time axis is taken to be negative. Also only the area enclosed between the x-axis and the graph is taken into account. Due to this in the first region the below area is not taken into account and in the second region the area found to be negative.
Also the slope of velocity versus time graph will give the acceleration of the particle at that instant.
