Question
Physics Question on speed and velocity
The velocity (v) - time (t) plot of the motion of a body is shown below :
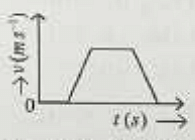
The acceleration (a) - time(t) graph that best suits this motion is :
A

B

C

D

Answer
Explanation
Solution
From the v − t graph, acceleration is the slope. During intervals, slope is constant and changes in steps, matching the stepped graph.