Question
Question: The velocity-time graph of a particle in one-dimensional motion is shown in the figure. Which of the...
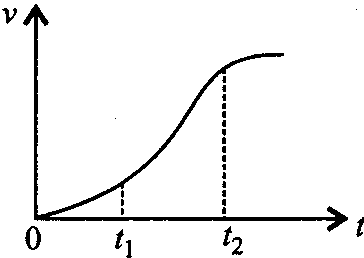
The velocity-time graph of a particle in one-dimensional motion is shown in the figure. Which of the following formulae is correct for describing the motion of the particle over the time interval t1 to 2 ?
A
x(t2)=x(t1)+v(t1)(t2−t1)+(21)a(t2−t1)2
B
v(t2)=v(t1)+a(t2−t1)
C
vaverage =(t2−t1)(x(t2)+x(t1))
D
aaverage =(t2−t1)(v(t2)−v(t1))
Answer
aaverage =(t2−t1)(v(t2)−v(t1))
Explanation
Solution
In the given interval the slope of v-t graph (i.e. accelerations) neither constant nor uniform . Therefore relations (1), (2) and (3) are incorrect but (4) is correct.