Question
Question: The velocity time graph of a body is shown in the diagram below. The slope of the line is provided a...
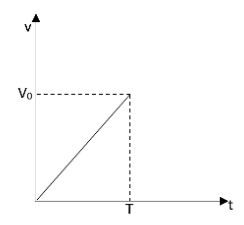
The velocity time graph of a body is shown in the diagram below. The slope of the line is provided as m. The distance travelled by the body in a time T second will be?
A.2TmV02B.2TV02C.2mV02D.2mV02
Solution
The slope of a graph can be calculated by taking the ratio of the values given in the y-axis to the same in the x-axis. The area under the curve represents the product of the values mentioned in the x and y axes. The distance is given by taking the product of the velocity of the particle and the time taken for it. These all may help you to solve this question.
Complete answer:
Let us assume that the distance travelled is expressed as d. The velocity with which they travel is given as V0. The time taken is expressed as T. And the slope of the graph will be given as m.
The area under a curve is defined as the product of the parameters mentioned in the x-axis and the y-axis. As we can see that the curve is a triangle the area under the curve is given as,
Area of triangle=21xy
Therefore the area under this curve will be,
A=21×V0×T
This area under the curve is represented as the distance as it is the product of velocity and the time taken.
d=21×V0×T
The slope of the graph is given by the equation,
m=TV0
Rearranging this equation in terms of the time taken will give,
T=mV0
Substituting this value in the equation of distance travelled will give,
d=21×V0×mV0=2mV02
So, the correct answer is “Option D”.
Note:
Velocity is defined as the variation of the position of a body with respect to time. This can be expressed in the form of derivative. The derivative of the distance travelled is given as the velocity. Velocity is a vector quantity which is both magnitude and direction.