Question
Question: The variation of the velocity of a particle moving along a straight line is illustrated in the graph...
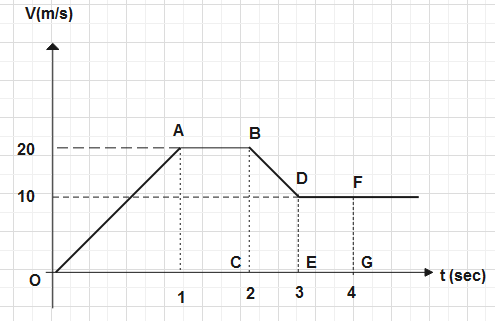
The variation of the velocity of a particle moving along a straight line is illustrated in the graph given below. The distance covered by the particle in 4 seconds is _______m.
Solution
In this type of question when velocity –time graph is given then the significance of velocity time graph is applied, velocity-time graph has two significance: - First significance is that its slope will give the information about velocity and second its area will give information about distance and displacement.
Complete step-by-step solution:
Here in this question we will find the area of the velocity –time graph because as we know that area of velocity- time graph will give the information about distance and displacement.
For distance all areas should be added either it is positive or negative while for displacement all areas are added with their respective signs.
So we calculate the area of this graph.
In this graph, we will mark the graph as points mentioned in the graph.
Here OABC is trapezium from time o to 2 seconds
and CBDE is also a trapezium from time 2 to 3 seconds
and last figure EDFG is a rectangle from time 3 to 4 seconds.
Now we calculate the area of each figure: -
Let us assume area of first figure Trapezium OABC is A1
So, A1=Area of Trapezium OABC
A1=21(Sumofparallelsides)×height
\Rightarrow $$$${{A}_{1}}=\dfrac{1}{2}(AB+OC)\times BC
\Rightarrow $$$${{A}_{1}}=\dfrac{1}{2}(1+2)\times 20
∴A1=30m
Let us assume the area of the second figure of trapezium CBDE isA2.
So, A2=Area of Trapezium CBDE
A2=21(Sumofparallelsides)×height