Question
Question: The variation of magnetic susceptibility with the temperature of a ferromagnetic material can be plo...
The variation of magnetic susceptibility with the temperature of a ferromagnetic material can be plotted as:
A) 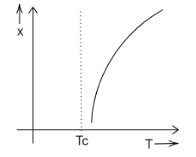
B) 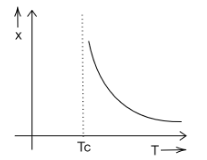
C) 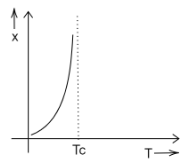
D) 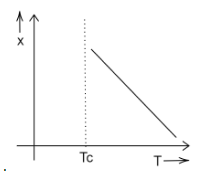
Solution
For a ferromagnetic material, the susceptibility decreases with temperature, and has an inverse proportionality with it. There is no decrease in susceptibility before the Curie’s temperature, but after this it starts decreasing with rise in temperature.
Complete step by step solution:
Ferromagnetic materials are those which interact very strongly with the magnetic fields and have the ability to become permanent magnets. Metals like Fe, Ni, and Co are some examples of ferromagnetic materials. As soon as they come across a magnetic field the magnetic domains are arranged in the same orientation resulting in high degree of magnetization.
The magnetic susceptibility is a measure of how much a material becomes magnetized when in a magnetic field. It is represented by χ. It can be defined as the ratio of Magnetization and the applied magnetic field intensity. The value of χvaries for different materials. For ferromagnetic materials, the susceptibility has a high positive value, which generally is not proportional to the intensity of the applied magnetic field.
However, it is dependent on the temperature of material. After a particular temperature, known as Curie’s temperature (TC), it starts decreasing because the increased temperature also increases random motion between the molecules, this counteracts the magnetization and thus decreases the susceptibility of the material.
This relation can be mathematically represented by-
χm=T−TCC Above the curie’s temperature.
Here C is a constant, depending on the material, TCis the Curie’s temperature, thus we obtain that,
χm∝T1
Since the value of χdecreases with increasing temperature, does not have a proportional value before the curie’s temperature and decreases inversely, therefore the graph shown in option (B) fits perfectly.
Option (B) is the answer.
Note:
When quantities are inversely proportional to each other, the graph plotted between them has a shape of rectangular hyperbola. The slope of this curve ranges fromtan90∘totan180∘, that is it tends from ∞at the start of the curve and 0as the value of the independent variable increases.