Question
Question: The \(v−t\) plot of a moving object is shown in the figure. the average velocity of the objects that...
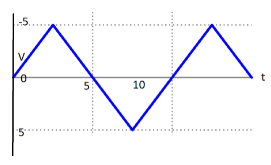
The v−t plot of a moving object is shown in the figure. the average velocity of the objects that first 10 seconds is then
A. 0 m/s
B. 2.5 m/s
C. 5 m/s
D. 7.5 m/s
Solution
The rate of change of an object's location with regard to a frame of reference is its velocity, which is a function of time. A definition of an object's speed and direction of travel is identical to velocity. In kinematics, the branch of classical mechanics that explains the motion of bodies, velocity is a basic notion.
Complete answer:
The velocity time graph shows that the velocity is constant (c) during the time span when the velocity is constant. The velocity of all particles of matter will be c at all times, regardless of how much time passes. In this situation, we've assumed a positive beginning velocity. If the starting velocity is negative, the graph will be different.
When the acceleration is constant (positive) and the particle's starting velocity is zero, the particle's velocity will grow linearly with respect to time. The magnitude of acceleration will be determined by the graph's slope.As we all know, the area beneath a velocity-time graph represents an object's displacement.
The graph is producing two triangles with the same area but in opposing quadrants. As a result, the area of the two triangles added together equals zero. (Because the sign is the polar opposite of both). As a result, the average velocity is nil.
Hence option A is correct.
Note: An object must have a constant speed in a constant direction to have a constant velocity. The object's motion is restricted to a straight route when it has a constant direction. As a result, motion along a straight line at a constant speed is referred to as constant velocity. The scalar magnitude of a velocity vector, speed, solely indicates how quickly an item is travelling.