Question
Question: The V-I graph for a conductor at temperatures \(T_1\) and \(T_2\) are shown in the figure, Then (\(T...
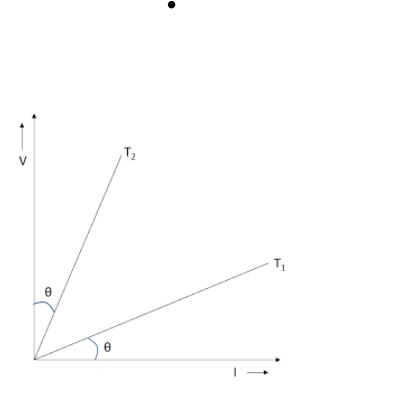
The V-I graph for a conductor at temperatures T1 and T2 are shown in the figure, Then (T2 – T1) is proportional to:
A. tan 2θ
B. sin 2θ
C. cos 2θ
D. cot 2θ
Solution
For this question we will use the fact that the resistance of a body is proportional to its temperature. We will find the slope of the graph which will be equal to the resistance of the conductor and then solve according to the linear relation of resistance and temperature.
Complete step-by-step answer:
According to Ohm’s law, the slope of the V-I graph will be equal to the resistance on the material at those temperatures. The difference between the resistances at two different temperatures is proportional to the difference in temperatures. Resistance of an object is linearly dependent on temperature.
So, cotθ−tanθ∝T2−T1