Question
Question: The tendency of two species to be disproportionate can be determined by examining the? A.Phase dia...
The tendency of two species to be disproportionate can be determined by examining the?
A.Phase diagram
B.Volume VS Temperature graph
C.Frost Diagram
D.Heat Capacity VS temperature graph
Solution
The phase diagram represents physical changes of elements who are under different conditions in temperature and pressure. Heat capacity is a function of temperature. The phase diagram represents the limit stability of various phases at equilibrium with respect to temperature, composition, etc.
Complete step by step solution:
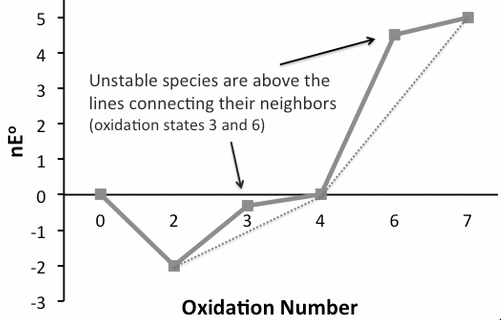
It is determined by examining the frost diagram of the oxidation state. These diagrams are also called oxidation state diagrams. This diagram is the plot of the oxidation state vs free energy of species. Properties of the oxidation state of various elements are represented in this diagram. Multiplying the number of electron transfers during oxidation state change to standard reduction potential for change occurred we get values to be plotted on the y-axis. A species that is located at the bottom of the diagram is said to be thermodynamically stable. Since species that are thermodynamically stable are located at the bottom as per oxidation-reduction point of view. A species can undergo disproportion if it is situated in the convex curve of the diagram. Species which are under standard condition whose pH is 0 for acidic condition and 14 for basic condition only their information can be obtained in the frost diagram. Strong oxidizing agents are located on the upper left side of the diagram. Reducing agents are located on the upper right side of the diagram. The thermodynamic stability of the species is determined by this diagram.
So, the option (C) frost diagram.
Note :
The relative stability of the species may vary on the change in pH. Some species are thermodynamically unstable towards reduction, they show very slow kinetics. Species on the concave curve do not disproportionate.