Question
Question: The temperature time variation graphs as obtained by four students A, B, C and D are as shown. The g...
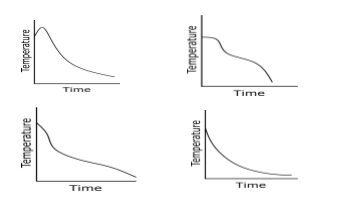
The temperature time variation graphs as obtained by four students A, B, C and D are as shown. The graph, likely to be correct is that of student
Solution
The graph between temperature and time can be explained by Newton’s law of cooling. When the temperature difference between object and surrounding is high then rate of heat loss is high.
Step by step solution:
According Newton’s law of cooling the rate at which a body loses heat by radiation depends on
-The temperature of the body
-The temperature of the surrounding medium
Newton’s law of cooling states that the rate of cooing (or heat loss) of body is directly proportional to temperature difference between the body and its surroundings
It can be expressed in mathematical form
Assume a hot body at temperature T let T0 be the temperature of its surroundings according to Newton’s law of cooling
Rate of loss of heat ∝ Temperature difference between the body and its surroundings
⇒−dtdQ∝(T−T0)
⇒−dtdQ=k(T−T0)
Where k is proportionality constant depending upon the area and nature of the surface of the body
Let m be the mass of body and c is the specific heat
If the body falls by small amount dT in time dt then amount of heat loss is
⇒dQ=mcdt
Rate of heat loss given by
⇒dtdQ=mcdtdT
Combine both above equations
⇒−mcdtdT=k(T−T0)
⇒dtdT=−mck(T−T0)
This is the mathematical expression of Newton’s law of cooling
It is clear from the above equation that the rate of cooling is higher initially and then decreases as the temperature of the body falls. If we plot a graph between temperature and time

Hence option D is correct
Note: This is in accordance with Newton’s law of cooling that a hot water bucket cools fast initially until it gets lukewarm after which it stays so for a longer time.