Question
Question: The speed-time graph of a particle moving along a fixed direction is shown in the figure. The distan...
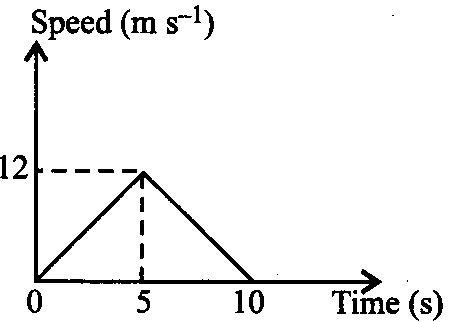
The speed-time graph of a particle moving along a fixed direction is shown in the figure. The distance traversed by the particle between t = 2 s the particle t = 6 s is
26 m
36 m
46 m
56 m
36 m
Solution
Let S1 be the distances travelled by particle in time 2 to 5 s and S2be the distance travelled by particle in time 5 to 6s.
∴Total distance travelled, S= S1+S2.
During the time interval 0 to 5s, the accelerations of particle is equal to the slope of line OA.
i.e., a=512=2.4ms−2
Velocity at the end of 2s will be.
V = 0 + 2.4×2=4.8ms−1
Taking motion of particle for time interval 2s to 5s,
Here, u = 4.8ms−1,a=2.4ms−2,
S=S1,t=5−2=3s
Then. S1=4.8×3+21×2.4×32=25.2m
Accelerations of the particle during the motion t = 5 s to t = 10s is
A = Slope of line AB = −512=−2.4ms−2
Taking motions of the particle for the time 1s (i.e. 5s to 6s),
Here, u = 12m s−1,a =- 2.4ms−2, t = 1s , S=S2
∴ S2=12×1+21(−2.4)×12=10.8m
∴ S=S1=25.2+10.8=36m