Question
Question: The speed-time graph of a particle moving along a fixed direction as shown in the figure. The distan...
The speed-time graph of a particle moving along a fixed direction as shown in the figure. The distance traversed by the particle between t = 0 s to t = 10 s is

A
20 m
B
40 m
C
60 m
D
80 m
Answer
60 m
Explanation
Solution
Distance = Area under speed – time graph over a given time interval.
∴Distance traversed by the particle between
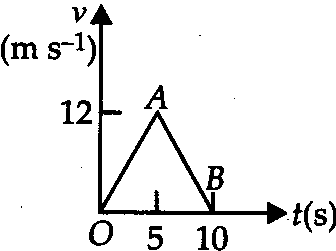
t = 0s to t = 10 s will be = Area of ΔOAB
=21×10×12 60 m