Question
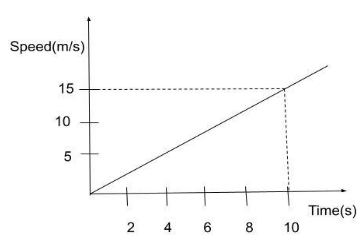
Question: The speed-time graph of a car is shown in figure. The distance travelled by the car in \(10\) second...
The speed-time graph of a car is shown in figure. The distance travelled by the car in 10 seconds will be:
Solution
When looking at the graph we've attached, it's clear that the Y-axis represents speed and the X-axis represents time. If we take a closer look at the graph, we can see that the distance travelled in a given amount of time must be measured.
Complete step by step answer:
Before going through the question let us first know about motion in a straight line. Straight line motion is described as motion that follows the same path or direction without changing its path or direction. Speed-time graphs are extremely useful when illustrating the movement of an object.
They can be used to determine whether or not an object is moving at any given point in time. They can also be used to calculate the speed of an object at any given point in time.
We can use data from the graph to calculate any acceleration, change in speed, or change in time.
Graphs can also be used to determine how far we've travelled.The region under a speed-time graph represents the distance travelled. Now, coming to the question,
Distance travel by the car = Area under the graph
Distance travel by the car=21×15×10=75m
Hence, the distance travelled by the car in 10sec will be 75m.
Note: An acceleration is represented by a sloping line on a speed-time graph. The sloping line indicates that the object's speed is changing. The object is either accelerating or decelerating. The greater the acceleration, the steeper the line's slope.