Question
Question: The shoppers who come to a departmental store are marked as: man(M), woman(W), boy(B) or girl(G). th...
The shoppers who come to a departmental store are marked as: man(M), woman(W), boy(B) or girl(G). the following list gives the shoppers who came during the first hour in the morning:
W, W, W, G, B, W, W, M, G, G, M, M, W, W, W, W, G, B, M, W, B, G, G, M, W, W, M, M, W, W, W, M, W, B, W, G, M, W, W, W, W, W, G, W, M, M, W, W, M, W, G, W, M, G, W, M, M, B, G, G, W
Make a frequency distribution table using tally marks. Draw a bar graph to illustrate it.
Solution
From the question given we have to write the frequency distribution table with tally marks and we have to draw a bar graph. First, we have to count the shoppers separately then we have to proceed further.
Complete step-by-step answer:
From the question given we have to write the frequency distribution table and we have to draw the bar graph,
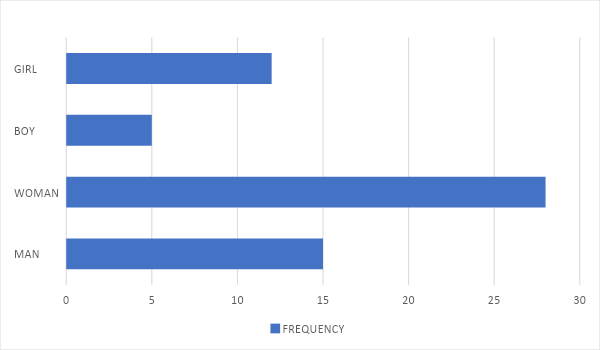
First, we will tally the shopper who are man, M, M, M, M, M, M, M, M, M, M, M, M, M, M, M.
⇒M=15= \requirecancel∣∣∣∣\requirecancel∣∣∣∣\requirecancel∣∣∣∣
Now, we have to tally the shoppers who are woman, W, W, W, W, W, W, W, W, W, W, W, W, W, W, W, W, W, W, W, W, W, W, W, W, W, W, W, W
⇒W=28= \requirecancel∣∣∣∣\requirecancel∣∣∣∣\requirecancel∣∣∣∣\requirecancel∣∣∣∣\requirecancel∣∣∣∣∣∣∣
Now, we have to tally the shoppers who are boys, B, B, B, B, B.
⇒B=5= \requirecancel∣∣∣∣
Now, we have to tally the shoppers who are girls, G, G, G, G, G, G, G, G, G, G, G, G.
⇒G=12= \requirecancel∣∣∣∣\requirecancel∣∣∣∣∣∣
Now we will make a frequency distribution table,
| SHOPPER | TALLY MARKS | FREQUENCY |
|---|---|---|
| MAN(M) | $\require{cancel}\cancel{ | |
| WOMAN(W) | $\require{cancel}\cancel{ | |
| BOY(B) | $\require{cancel}\cancel{ | |
| GIRL(G) | $\require{cancel}\cancel{ | |
| TOTAL | 60 |
Now we have to draw the bar graph,
Note: Students should know the concept of statistics, students should know the difference between the pie graphs and bar graphs etc., students should be very careful while calculating the frequency.