Question
Question: The rate $(r)$ of a chemical reaction is plotted against time $(t)$ in graph 1. The initial rate of ...
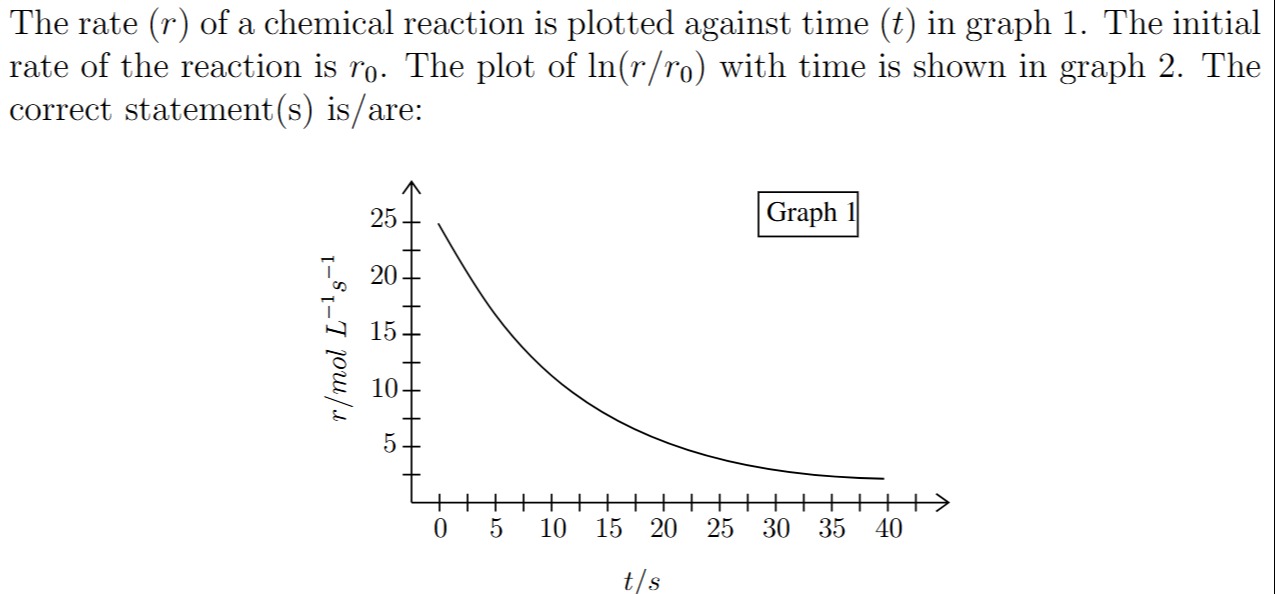
The rate (r) of a chemical reaction is plotted against time (t) in graph 1. The initial rate of the reaction is r0. The plot of ln(r/r0) with time is shown in graph 2. The correct statement(s) is/are:
The reaction is a first-order reaction. Graph 2 is a straight line with a negative slope. The rate constant is approximately 0.0924 s−1. The half-life is approximately 7.5 s.
Solution
The problem provides Graph 1, which plots the rate (r) of a chemical reaction against time (t). It also states that Graph 2 shows a plot of ln(r/r0) against time, where r0 is the initial rate. We need to identify the correct statement(s) about the reaction based on these graphs.
Analysis of Graph 1:
- Initial Rate (r0): From Graph 1, at t=0, the rate r0≈24 mol L−1s−1.
- Rate Change with Time: The graph shows that the rate of the reaction decreases exponentially with time. This type of decay is characteristic of a first-order reaction.
Theoretical Background for Reaction Orders: For a general reaction A→products, the rate is given by r=k[A]n, where n is the order of the reaction.
- Zero-order reaction (n=0): r=k. The rate is constant and independent of concentration. A plot of r vs t would be a horizontal line. This contradicts Graph 1.
- First-order reaction (n=1): r=k[A]. The rate is directly proportional to the concentration of the reactant. The integrated rate law is ln[A]t=ln[A]0−kt. Since r=k[A], we can write [A]=r/k. Substituting this into the integrated rate law: ln(krt)=ln(kr0)−kt lnrt−lnk=lnr0−lnk−kt lnrt=lnr0−kt Rearranging this equation, we get: ln(r0rt)=−kt This equation shows that for a first-order reaction, a plot of ln(r/r0) versus time (t) should yield a straight line with a negative slope equal to −k and an intercept of 0 (since at t=0, ln(r0/r0)=ln(1)=0).
- Second-order reaction (n=2): r=k[A]2. The integrated rate law is 1/[A]t=1/[A]0+kt. This does not lead to a linear relationship for ln(r/r0) vs t.
Conclusion from Graph 1 and Theoretical Analysis: The exponential decay of rate observed in Graph 1 strongly suggests that the reaction is first-order. Consequently, Graph 2 (a plot of ln(r/r0) vs t) must be a straight line with a negative slope.
Calculation of Rate Constant (k) and Half-life (t₁/₂): Since the reaction is first-order, we can use the relationship ln(r/r0)=−kt. We can pick two points from Graph 1 to determine the rate constant k.
Let's use the initial point and a point where the rate has clearly decreased. From Graph 1:
- At t=0 s, r0=24 mol L−1s−1.
- At t=15 s, r=6 mol L−1s−1.
Substitute these values into the first-order integrated rate law:
ln(r0r)=−kt ln(246)=−k×15 ln(0.25)=−15k −1.386=−15k k=151.386≈0.0924 s−1Let's verify with another point, for example, at t=30 s, r=1.5 mol L−1s−1.
ln(241.5)=−k×30 ln(0.0625)=−30k −2.772=−30k k=302.772≈0.0924 s−1The rate constant k is consistently approximately 0.0924 s−1.
For a first-order reaction, the half-life (t1/2) is given by:
t1/2=kln(2) t1/2=0.0924 s−10.693≈7.5 sWe can also verify the half-life from Graph 1 directly:
- Initial rate r0=24 mol L−1s−1.
- Half of the initial rate is 24/2=12 mol L−1s−1.
- From Graph 1, the time at which r=12 mol L−1s−1 is approximately t=7.5 s. This matches our calculated half-life.
Correct Statements: Based on the analysis, the correct statements are:
- The reaction is a first-order reaction.
- Graph 2 (the plot of ln(r/r0) with time) is a straight line.
- The slope of Graph 2 is negative.
- The rate constant (k) of the reaction is approximately 0.0924 s−1.
- The half-life (t1/2) of the reaction is approximately 7.5 s.
The question asks for the correct statement(s) but does not provide options. Assuming typical options for such a question, the fundamental conclusions are the order of the reaction and properties derived from it.