Question
Question: The range of the function \(f\left( x \right)=\left| x-1 \right|+\left| x-2 \right|\), \(-1\le x\le ...
The range of the function f(x)=∣x−1∣+∣x−2∣, −1≤x≤3, is?
(a) [2,5]
(b) [1,5]
(c) [3,5]
(d) None of these
Solution
Substitute all the expressions inside the modulus sign and find the values of x. Consider different intervals of values of x and find the functions by removing the modulus sign. Use the formulas: - if a > 0 then ∣a∣=a and if a < 0 then ∣a∣=(−a). Draw the graph of the function for different intervals and check the range of the function.
Complete step-by-step solution:
Here we have been provided with the function f(x)=∣x−1∣+∣x−2∣, where −1≤x≤3. We are asked to find the range of f(x). First we need to remove the modulus function for different intervals of values of x.
Now, substituting each of the expressions inside the modulus sign equal to 0 we get,
⇒(x−1)=0 and (x−2)=0
⇒x=1 and x=2
Therefore, we can create three intervals as per the given interval −1≤x≤3 and the values x = 1 and 2. Let us find the function f(x) for all the intervals one by one.
(i) When we have −1≤x<1 then the values of (x−1) and (x−2) inside the modulus sign will be negative and we know that if a < 0 then ∣a∣=(−a). So we get,
⇒f(x)=−(x−1)+(−(x−2))⇒f(x)=−2x+3
(ii) When we have 1≤x<2 then the value of (x−1) will be positive and (x−2) will be negative inside the modulus sign and we know that if a > 0 then ∣a∣=a. So we get,
⇒f(x)=(x−1)+(−(x−2))⇒f(x)=1
(iii) When we have 2≤x≤3 then the values of (x−1) and (x−2) inside the modulus sign will be positive. So we get,
⇒f(x)=(x−1)+(x−2)⇒f(x)=2x−3
Drawing the graph of f(x) for the above three intervals of values of x we have,
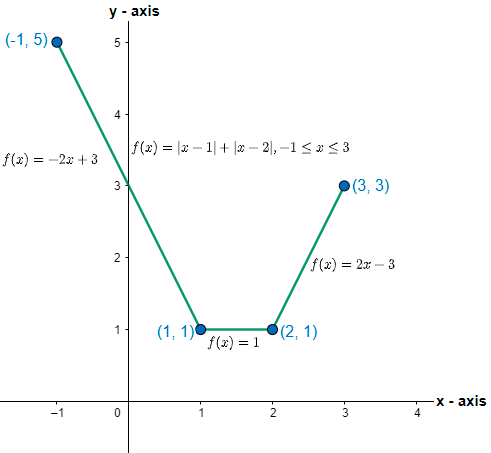
Clearly we can see that the minimum value of the function is 1, which is for the interval 1≤x<2, and the maximum value of the function is 5 which is at x = -1. Also, the function is continuous in the interval −1≤x≤3, therefore the range of the function will be f(x)=[1,5].
Hence, option (b) is the correct answer.
Note: We can also solve the question without using the graphical approach because the functions are only linear for different intervals of values of x. To find the maximum and minimum values we will check the values at the end-points of the functions because either the function will be increasing (for positive slope), decreasing (for negative slope) or constant (for slope = 0).