Question
Question: The position-time graph for a particle moving along a straight line is shown in figure. The total di...
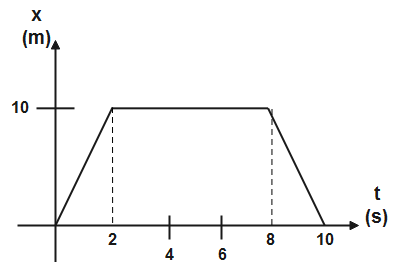
The position-time graph for a particle moving along a straight line is shown in figure. The total distance travelled by it in time t=0 to t=10s is
(A). zero
(B). 10m
(C). 20m
(D). 30m

Solution
The following graph shows the motion of a particle in a straight line using distance and time. The total distance travelled by the particle will be the sum of distances travelled in all the time intervals. The line parallel to the x-axis depicts that the particle does not change position.
Complete answer:
Distance is a scalar quantity and its magnitude is represented by its unit. Its SI unit is metres (m).
Given that the distance of a particle changes with time and its motion is depicted by the following position time graph.
The particle travels in a straight line.
Here, the position of the particle is the dependent quantity and time is the independent quantity.
According to the graph, the particle travels 10m in the first 2s. After that, for time; 8−2=6s the particle remains at the same position. Then in the next 10−8=2s, it travels another 10m back to its original position at x=0. Therefore, the total distance travelled by the particle will be-
10m+10m=20m
Therefore, the total distance travelled by the particle is 20m.
Hence, the correct option is (C).
Note:
For the motion of particles depicted in the above graph, the displacement is zero. Displacement is a vector quantity. The independent quantity is taken along the x-axis and the dependent quantity is taken along the y-axis. When the particle is stationary or at rest, the graph is a straight line parallel to the x-axis. The ratio of distance to time is called velocity, which is the distance travelled per second.